Hydrology
EESC
BC
3025
Field trip - Black Rock Forest (John & Martin)
4/14 & 4/15/2012
Saturday
"Old" forest headquarters (11-11:30)
8:45 am leave NYC on bus to LDEO (120th
St between Broadway & Amsterdam)
- meet John at LDEO
- pick up equipment at Barnard and LDEO,
buy lunch on the way
- 11:00 arrive at weather station, old
office
- take a GPS measurement at the station
(talk about GPS if time allows)
- collect GPS data at each location where
you work
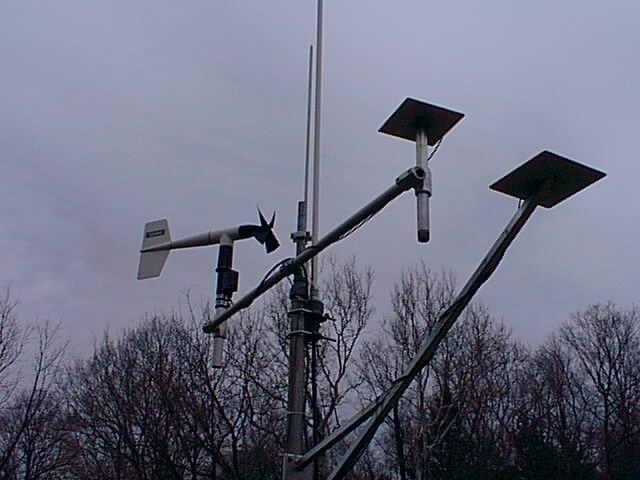
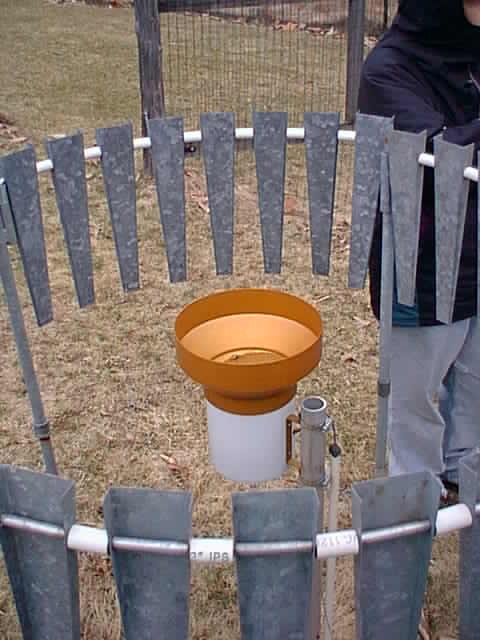
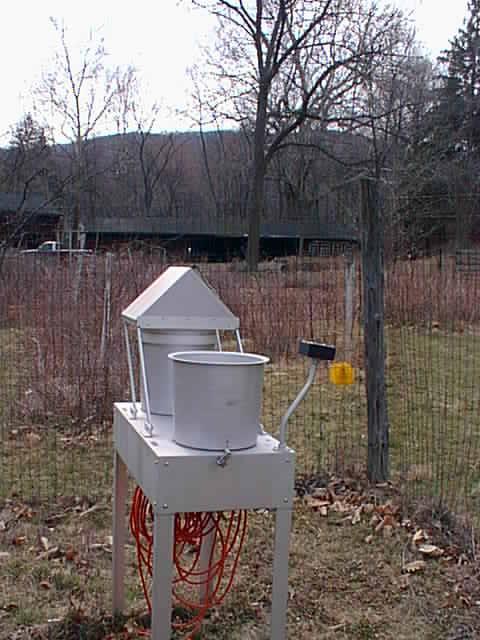
- weather station
- how do the instruments work (Fig 1, 2, 3, 4, 5, 6, 7, 8, 9, 10)
- begin relative humidity measurements
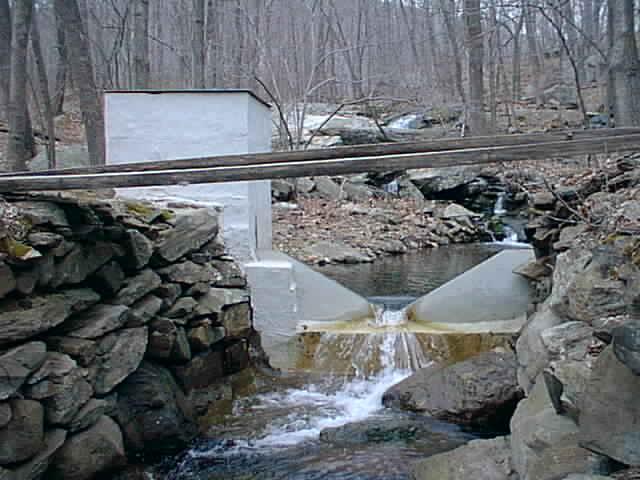
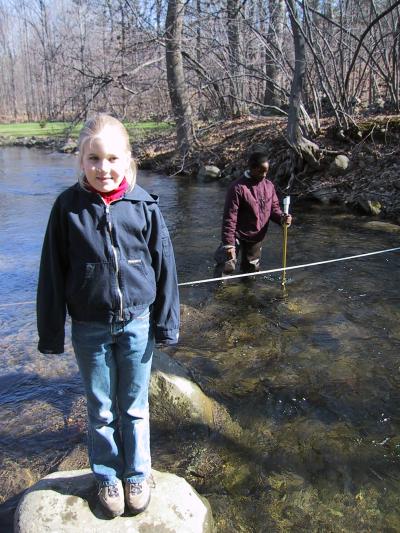
Stream gauging near old head quarter & other measurements
(11:30-2:30)
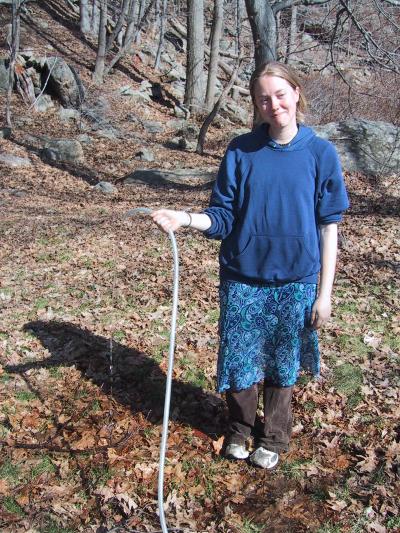
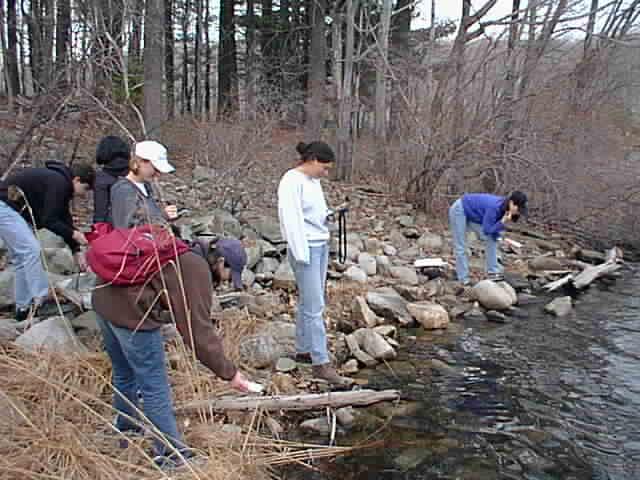
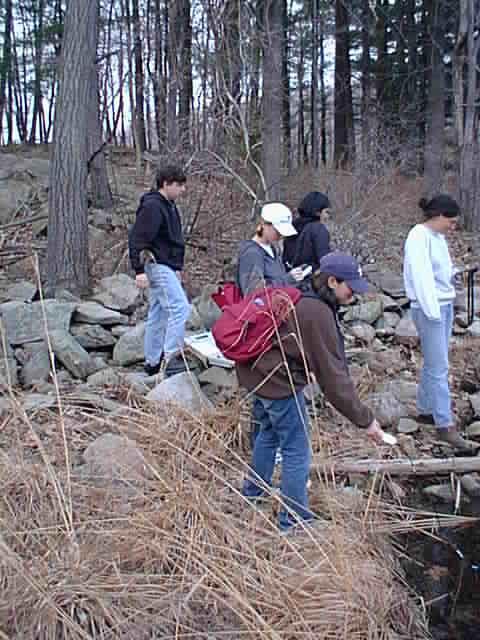
- Group 1 wading through stream
(red tape marking the trail) taking flow measurements
- BRF wand discharge rates
(Fig 1, 2, 3, 4, 5)
- BRF 03 measurements (Fig 1, 2, 3, 4)
- GPS measurements (Fig 1)
- briefly explain the YSI multi
parameter sensor, collect data on stream
- lunch
at old headquarters
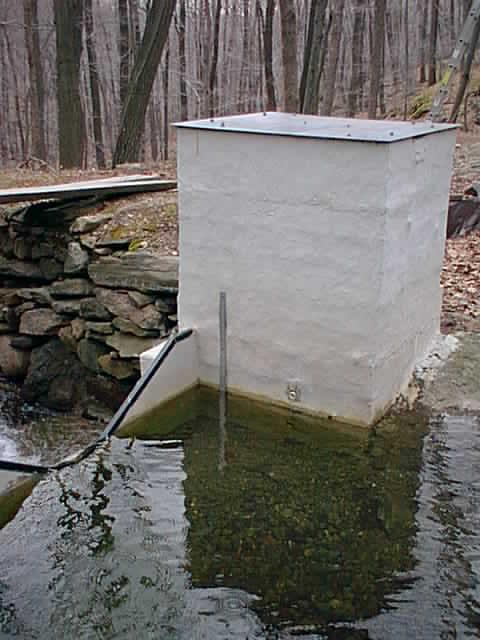
- Group 2
- measure hydraulic head in education
well (Fig 1,2)
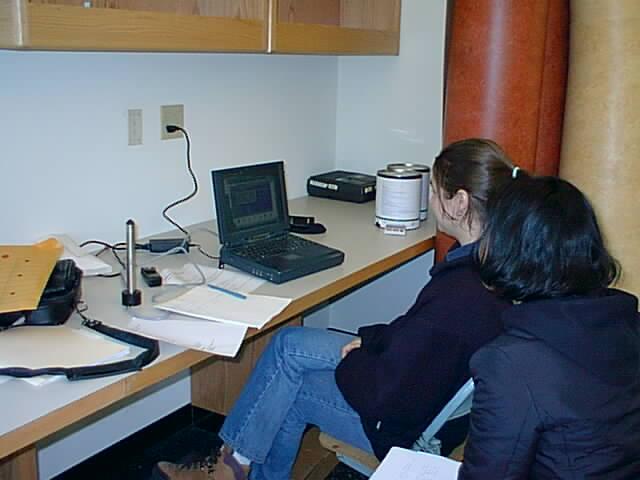
- use of automatic pressure
transducers (Fig 1)
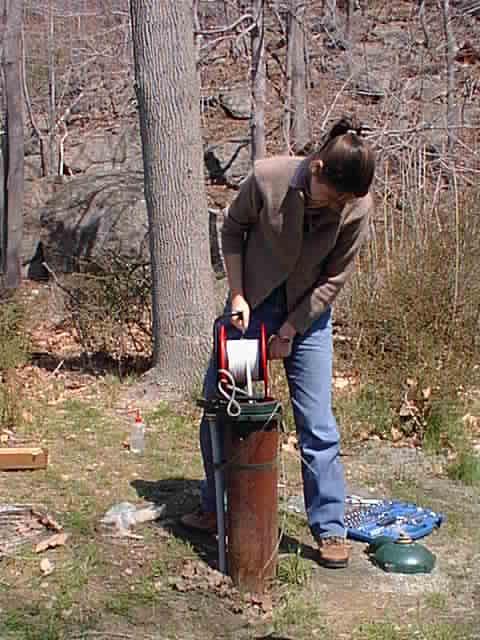
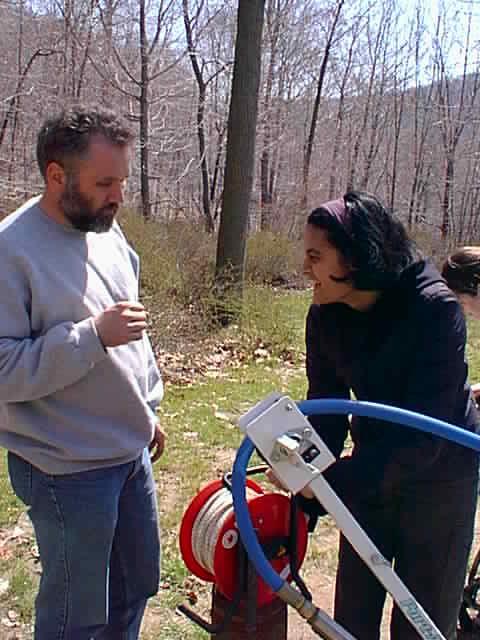
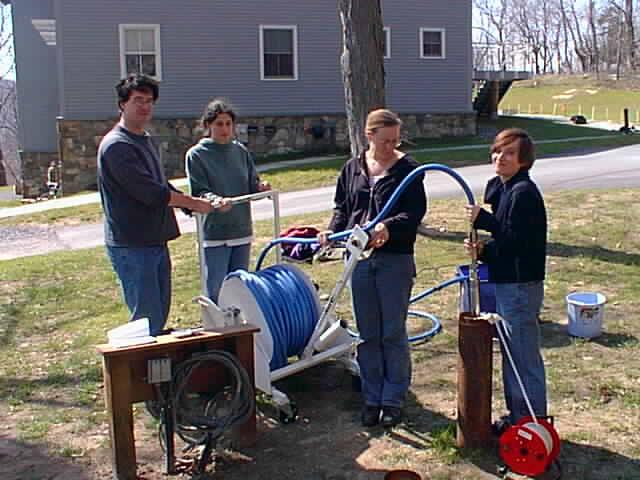
- pumping test
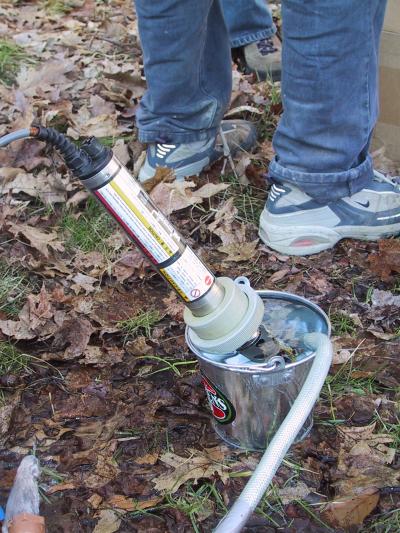
- pump experimental well (Grundfos)
and monitor water table in well (Fig 1,2,3,4,5)
- monitor recovery of the water
table after the shutoff of the pump (Fig 1, 2, )
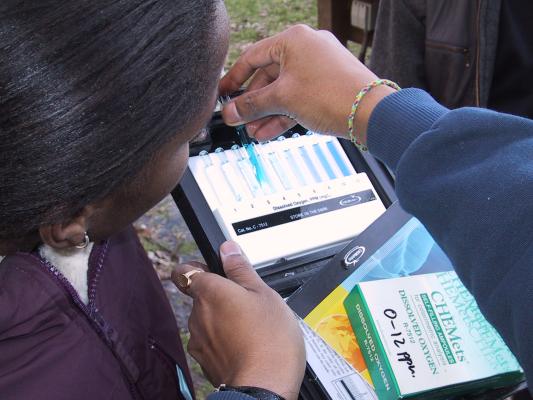
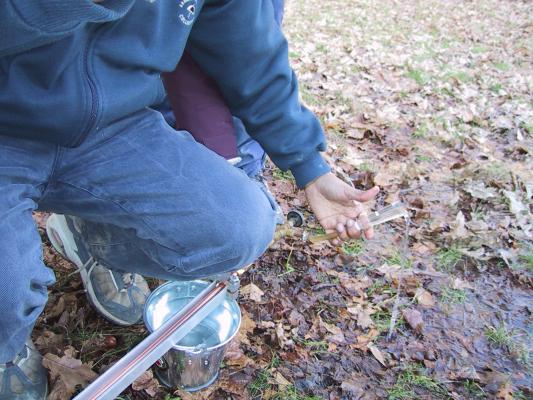
- sampling the well for: (Fig 1,2,3)
- conductivity, temperature, pH, O2
(Fig 1, 2)
- noble gases (Fig 1)
- filter water for chemistry sample
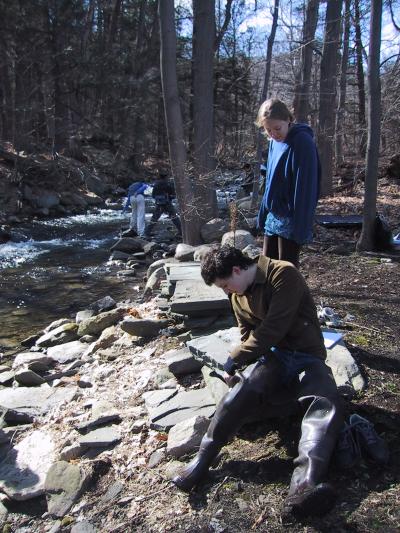
Stream gauging near old headquarters & Cascade Brook
(2:30-5:30)
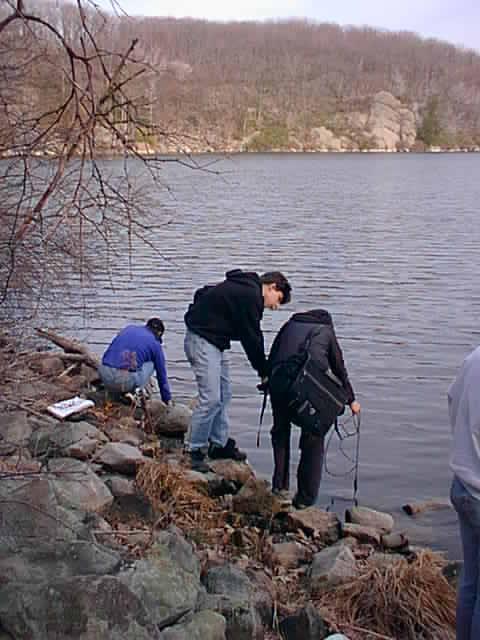
- Group 2 wading through stream (red tape
marking the trail) taking flow measurements
- BRF wand discharge rates (Fig 1,
2,
3,
4,
5)
- BRF 03 measurements (Fig 1,
2,
3,
4)
- GPS measurements (Fig 1)
- briefly explain the YSI multi
parameter sensor
- Group 1 Education Center
- measure hydraulic head in
both wells (Fig 1,2)
- use of automatic pressure
transducers (Fig 1)
- pumping test
- pump experimental well (Grundfos) and monitor water table
in both wells (Fig 1,2,3,4,5)
- monitor recovery of the water table after the shutoff of
the pump (Fig 1,
2,
)
- sampling the well for: (Fig 1,2,3)
- conductivity, temperature, pH, O2 (Fig 1,
2)
- noble gases (Fig 1)
- filter water for chemistry sample
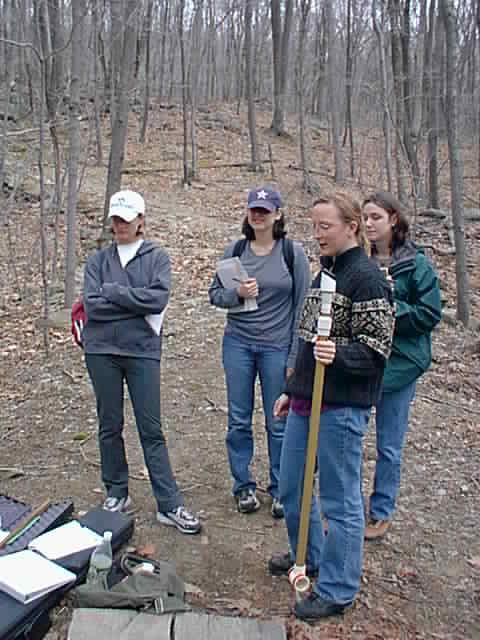
- measurement of the relative humidity as a function of
time during the day
Education Center (5-6)
- soil suction/moisture
measurements, vertical profile
- Relative humidity measurements
Sunday
Education Center and Forest 8-12
- both Groups 2 Education Center
- collection of samples for pH, O2, T, el.
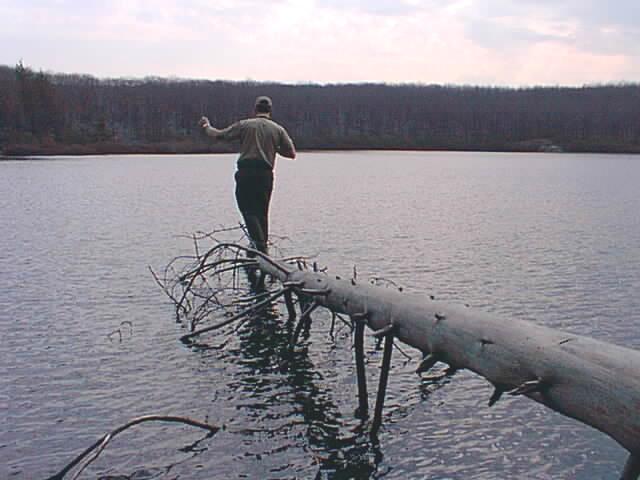
conductivity, GPS from: Upper Reservoir, Aleck Meadow,
Arthur's Pond, and Tamarack Pond (Fig 1, 2, 3, 4, 5, 6, 7)
- GPS
- visit Cascade Brook, open gauge?
- look at experimental plots
Education Center 11:30-12:30
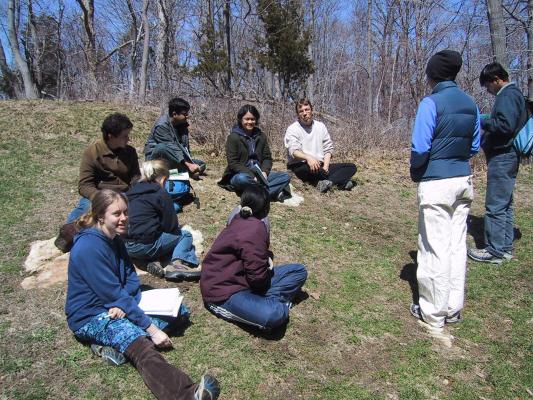
- research/history @ BRF (BRF staff?) (Fig 1)
- brief outline of the Black Rock Forest (BRF) history
- use of the reservoirs at BRF for domestic water supply
- what else is currently going on at BRF
- green building?
- lunch
NYC 2
- leave BRF at 12:30 pm
- arrival in NYC by 2 pm
What to hand in (to
be modified)
- Summarize in paragraph the history and the current status of
the forest, see BRF web site
for information
- Type in data obtained in the field into a spreadsheet
- Put GPS positions of all activities on topo map that I gave
you
- Do the positions make any sense
(longitude, latitude, and elevation)?
- Determine teh discharge rate of teh stream based on teh
measurements of your group.
- Determine the absolute humidity using your observations and
the water vapor saturation curve we discussed in class, plot
relative and absolute humidity as a function of the hour of the
day.
- Calculate the discharge rate of the stream near the old forest
head quarter, analyze just the data from your group.
- Plot all pH measurements as a function of elevation (include
stream measurements, all reservoirs and the groundwater sample).
Do you have an explanation for the trends you see? For info on
acid rain, see: NADP.
- Put YSI water quality measurements in a
table, just the final reading after equilibration was reached
is sufficient. Select one parameter (not pH) and plot it as a
function of elevation again. Do you see a trend and if so do
you have an explanation for it?
- Discuss in a few sentences the water
level and temperature changes shown in the posted graphs of
the well test of your group.
- Write a few sentences about what you
found most interesting during our trip.
- Summarize in a paragraph what citizens
in Rockland county should know about their water supply and
discuss a point made by the speakers/audience that you found
most interestiung.
Equipment
- 2 GPS instrument
- YSI plus sensors & standards
- filter & syringes
- bottles (plastic, glass)
- submersible Grundfos pump controller
& pump (on site)
- tools, adjustable wrench
- Leatherman
- some copper tubes, hoses
- digital camera
- water level tapes
- DBH
tape
- umbrella
- levelogger & interface
- computer for data logger readout
- bucket (BRF)
- rubber boots
- waders (on site)
- flowmeter
- cell phone
- hygrometer
- papers, BRF history, GPS, maps
- plots of Cascade Brook data (I will
put some of that on the class website)
- chemests O2 tests
- projector, laptop, speakers
- sunscreen
- first aid kit
- insurance, contact forms
- plant keys
- tree books?lack
- portable
microscope
Resources