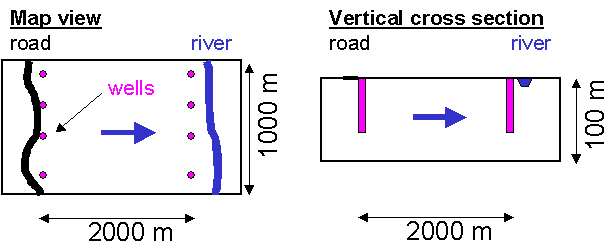
a) (4 points) Calculate this rate by using Darcy's law. The hydraulic conductivity is 1x10⁻³m/s, the distance between the two rows of wells 2000m, the thickness of the aquifer 100m and the width of the aquifer 1000m.
b) (4 points) The road is 2000m distant from the wells in row 2. How much time will pass after the spill until the contaminated water will reach the wells in row 2? The porosity of the aquifer is 0.3. (time = distance/velocity!)
2) (8 points) 14C is
produced
in the higher atmosphere by cosmic rays. Under natural
conditions, the
14C
activity or concentration in the atmosphere is per definition
set to 100
% modern [% mod]. The carbon in the CO2 molecule
therefore has
a 14C activity of 100 % mod. as well.
14C was measured on two samples
taken
along a flow line in a confined aquifer as summarized in the
following
table:
|
|
Distance from the recharge area [km] | 14C activity [% mod] |
|
|
|
|
|
|
|
|
a) (4 points) Calculate the age of the two samples under the assumption that the initial 14C activity in the recharge area (CO2 in the soil zone) was 85% modern. The half life of 14C is 5730 years. The age may be calculated in the following way:
![]()
b) (4 points) What is the flow
velocity of the water between
the two wells? Assume that dispersion and adsorption can be
neglected.
a) (4 points) Download the data(.csv file) and convert it into an EXCEL file and store under JACOB.XLS. The initial hydraulic head in the aquifer at the observation well was 2 m below the surface or 20 m above sea level. The file contains the hydraulic head data (in m above sea level) for the observation well as a function of time from the start of the pumping test. Convert the hydraulic head data into drawdown in meters and plot drawdown as a function of time with drawdown = 0 in the upper left corner. Describe the pattern that you see. When does the fastest drawdown occur? Print the plot.
b) (4 points) Make another plot similar to the one shown in Heath, p 39. Click the x-axis and change it into a logarithmic scale. Print the plot, it should look kind of similar to the one in the book. Use a ruler and a pen to manually determine delta S and to.
c) (4 points) Determine the transmissivity (=hydraulic conductivity * thickness of the aquifer), hydraulic conductivity, and storage coefficient from the formulas given on page 38/39.
d) (2 points) Based on the
values,
what kind of rock does the aquifer consist of (see Fig
6.5)?
Heath, R.C (1982) Basic Ground-Water Hydrology. United States Geological Survey Water-Supply Paper 2220, 84p. PDF file (complete document) or PDF file of pages 38/39 only.)