
| Station: Paleontological Research Institution, Museum of the Earth, Ithaca, New York | |
| Network Affiliation: LCSN & ANSS
Lamont-Doherty Cooperative Seismographic Network (LCSN) Advanced National Seismic System (ANSS) |
FDSN Network Code: "LD" |
| Network Contact:
Dr. Won-Young Kim Lamont-Doherty Earth Observatory of Columbia University 61 Route 9W Palisades, NY 10964 |
|
| Coordinates:
Latitude: 42.4666N Longitude: 76.5361W | Elevation to Sensor: 205 m
Depth to Sensor: 0 |
| Geology: Thin compact soil over Devonian shale (?) bedrock | |
| Vault Conditions: Sensor sits directly on concrete pier | |
| Site Description: Basement of the Museum of the Earth | |
| Station Instrumentation: Remote site:
Broadband seismometer (CMG-3ESP, 30 sec - 50 Hz) 24-bit A/D datalogger (Reftek 72A-07, 3-channel system) GPS clock deep-cycled sealed gelcell rechargable battery | |
| Data collection site:
PC Windows XP RTPD (Ref Tek Protocol Dataserver), Earthworm Data acquisition software | |
| Operated Since: March 20, 2006 | |

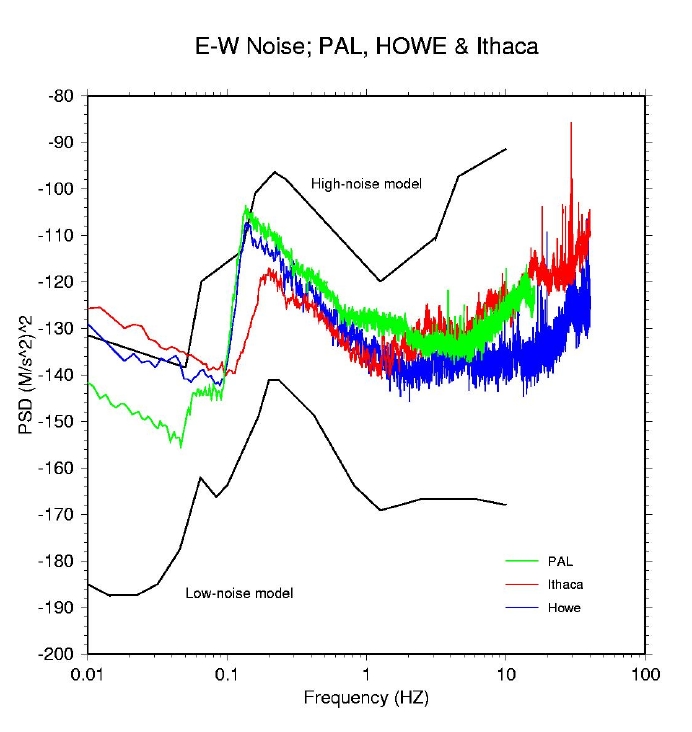
Vertical, North-South and East-West components of ambient ground noise spectra
on March 8, 2006 (at 18:00-20:00 UTC) measured at the seismic pier in the basement of
the Museum of the Earth in Ithaca, New York. In each figure, horizontal axis represent
frequency (inverse of period) in Hertz (Hz, cycle/sec) from 0.01 to 100 Hz, whereas the
vertical axis represents power spectral density in units of decibels refered to
1 (meter/s^2)^2 (=quare of the acceleration).
Hence, the seismic noise amplitude spectra are plotted as a function of frequency.
In each component, noise spectra from stations PAL (Palisades, NY; green line),
Howe Caverns, Cobleskill, New York (HCNY; blue line) and PRNY (Museum of the
Earth, Ithaca, New York; red line) are plotted for comparison.
Plotted together with the station noise spectra are solid curve representing the
low- and high-noise models.
Noise spectra at PRNY are comparable to PAL at frequencies between 1 and 10 Hz,
whereas PRNY noise spectra at lower frequencies between 0.1 and 1 Hz are
lower than at PAL and comparable to HCNY. Notice that noise spectral peak at
PRNY is about 0.2 Hz (5 second-period), which is slightly shorter period than
at PAL and HCNY (7-8 second-period), probably due to lower microseism at PRNY.
It may be due to farther distance from the Atlantic Ocean than PAL or HCNY.
Higher noise power spectral density at long-period (> 10 sec) bands at HCNY
and PRNY compared with that of PAL are due to shorter natural period seismometers used
at these stations (HCNY, PRNY, T0=30 sec; PAL, T0=120 sec).
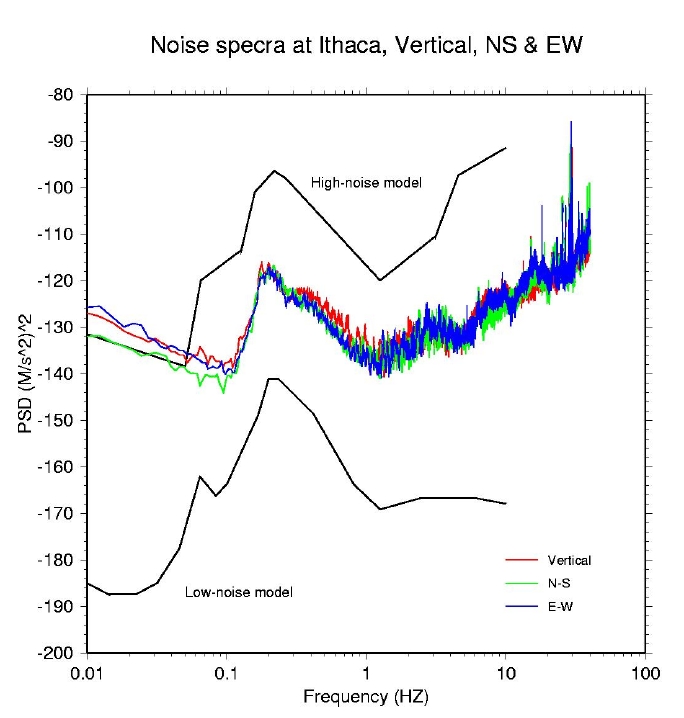
Three component noise spectra at PRNY are plotted for comaprison.
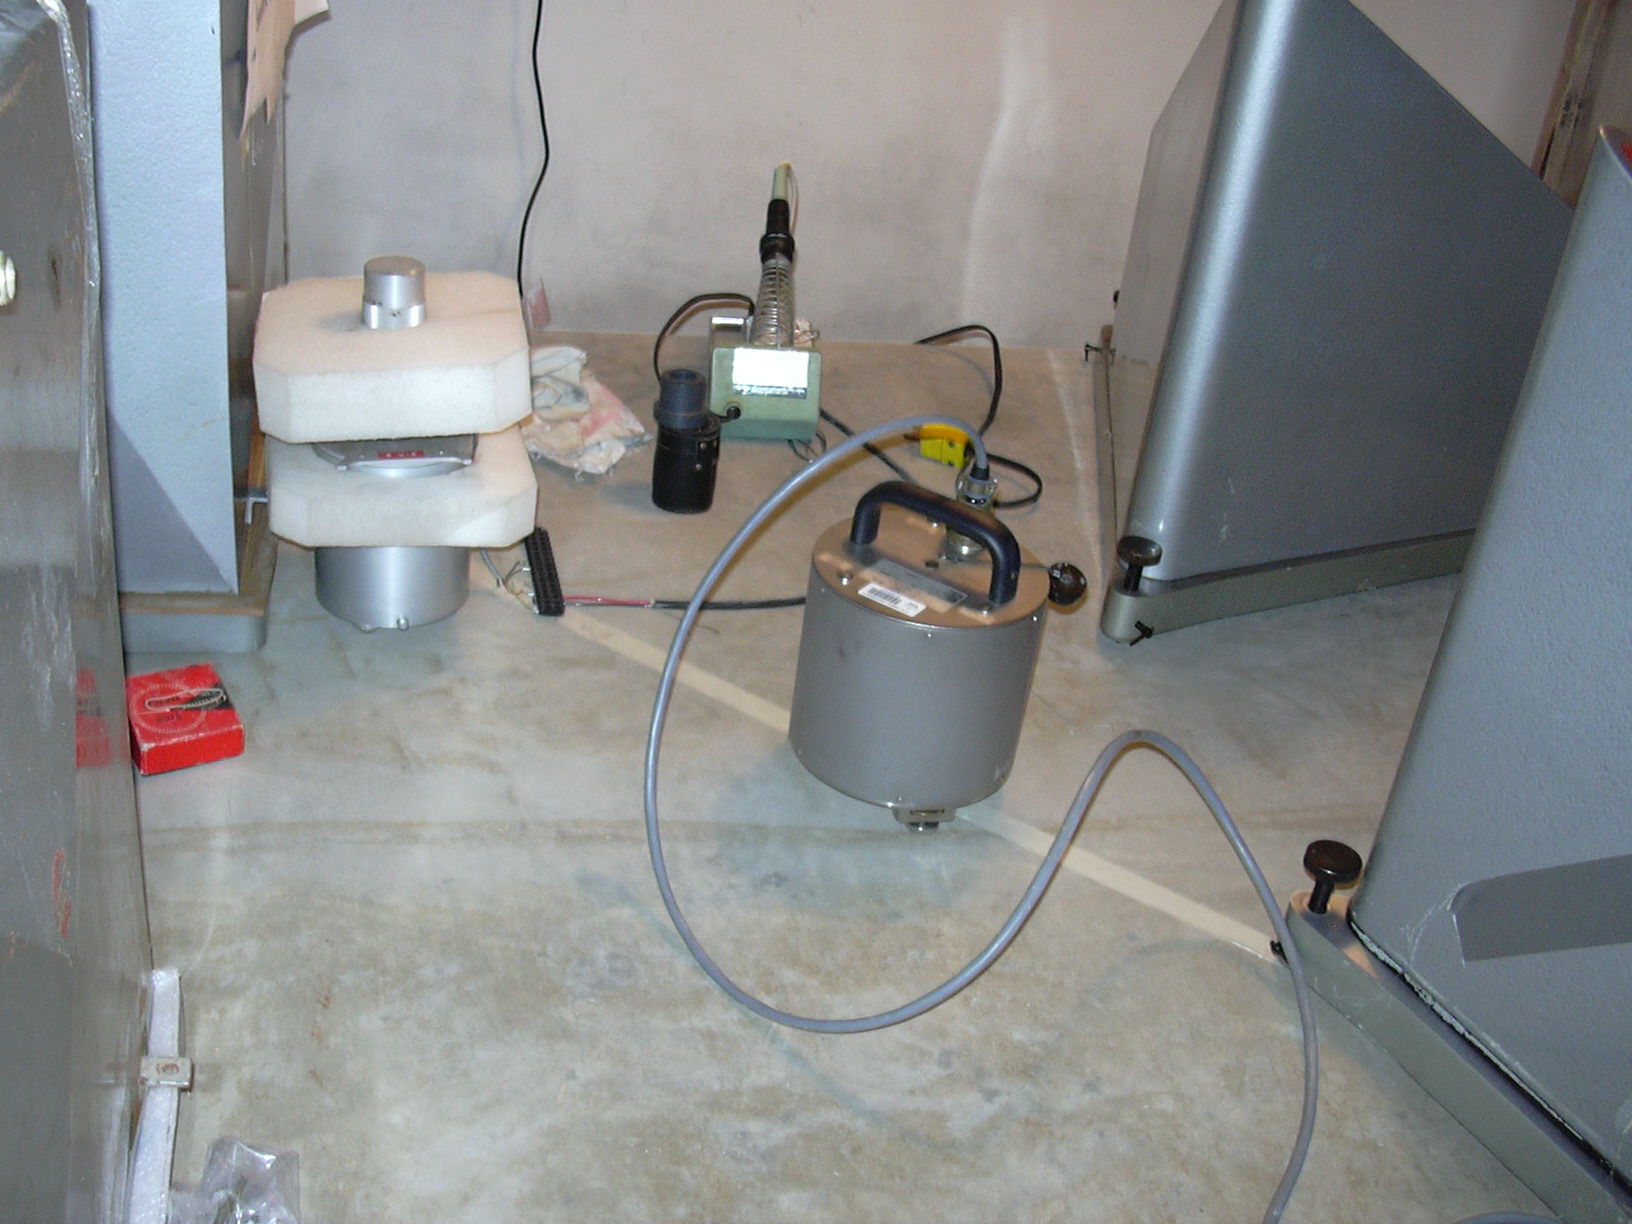
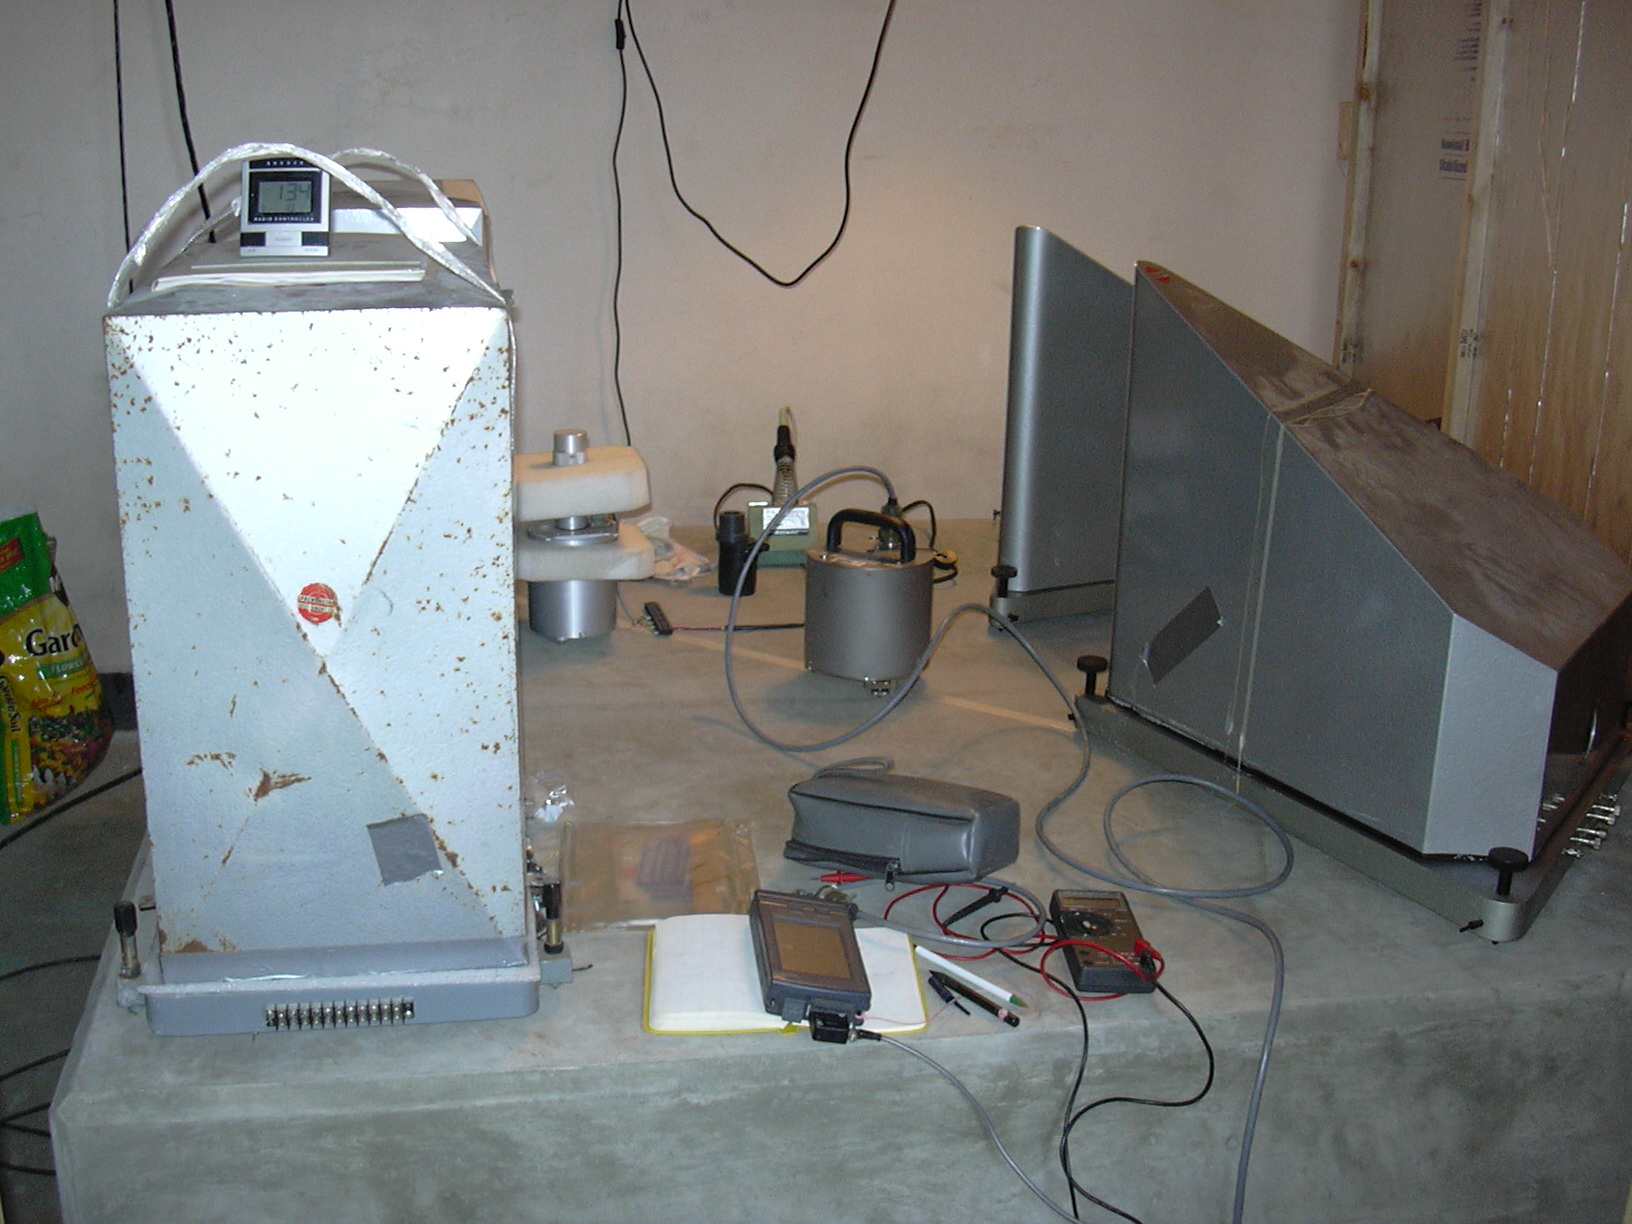
Seismic pier in the basement of the Paleontological Research Institution building

Data Acquisition System (DAS; 24-bit A/D datalogger, Reftek RT-72A-07)

GPS antenna outside of the PRI building
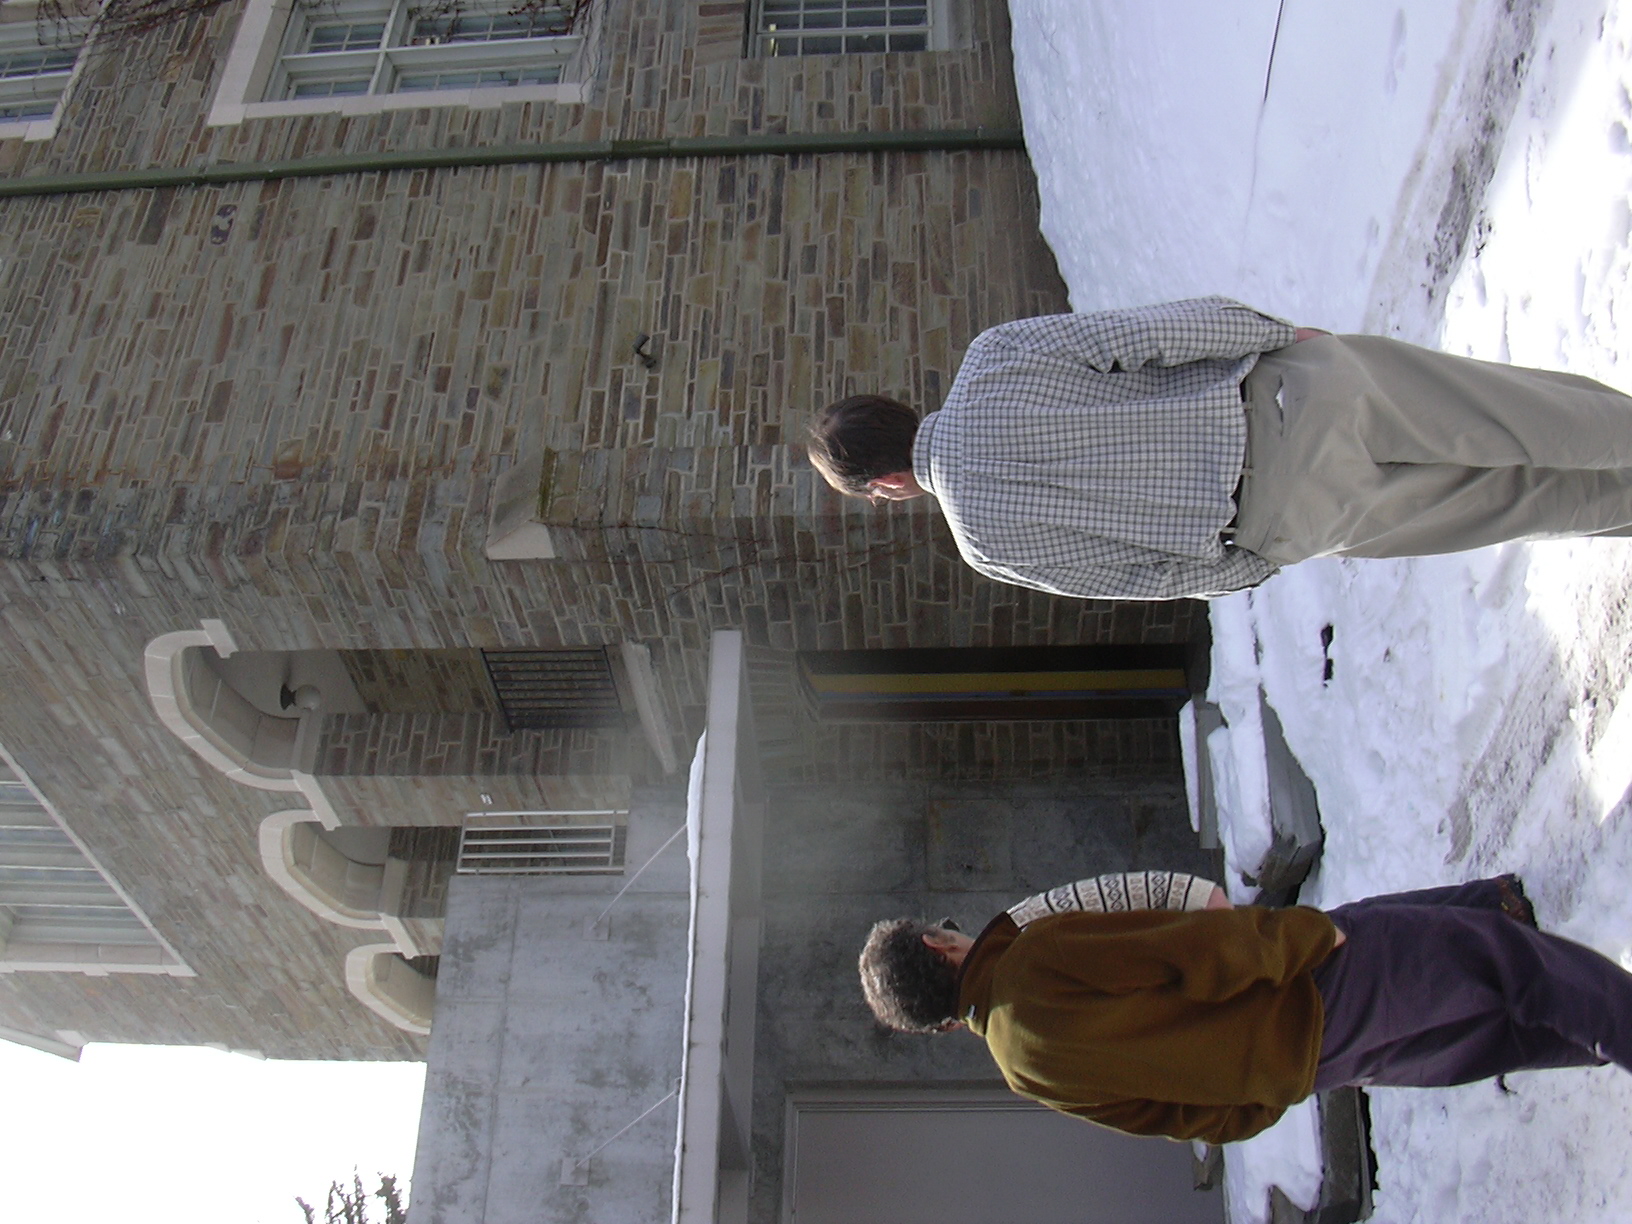
Enterance to the seismic vault in the Paleontological Research Institution building
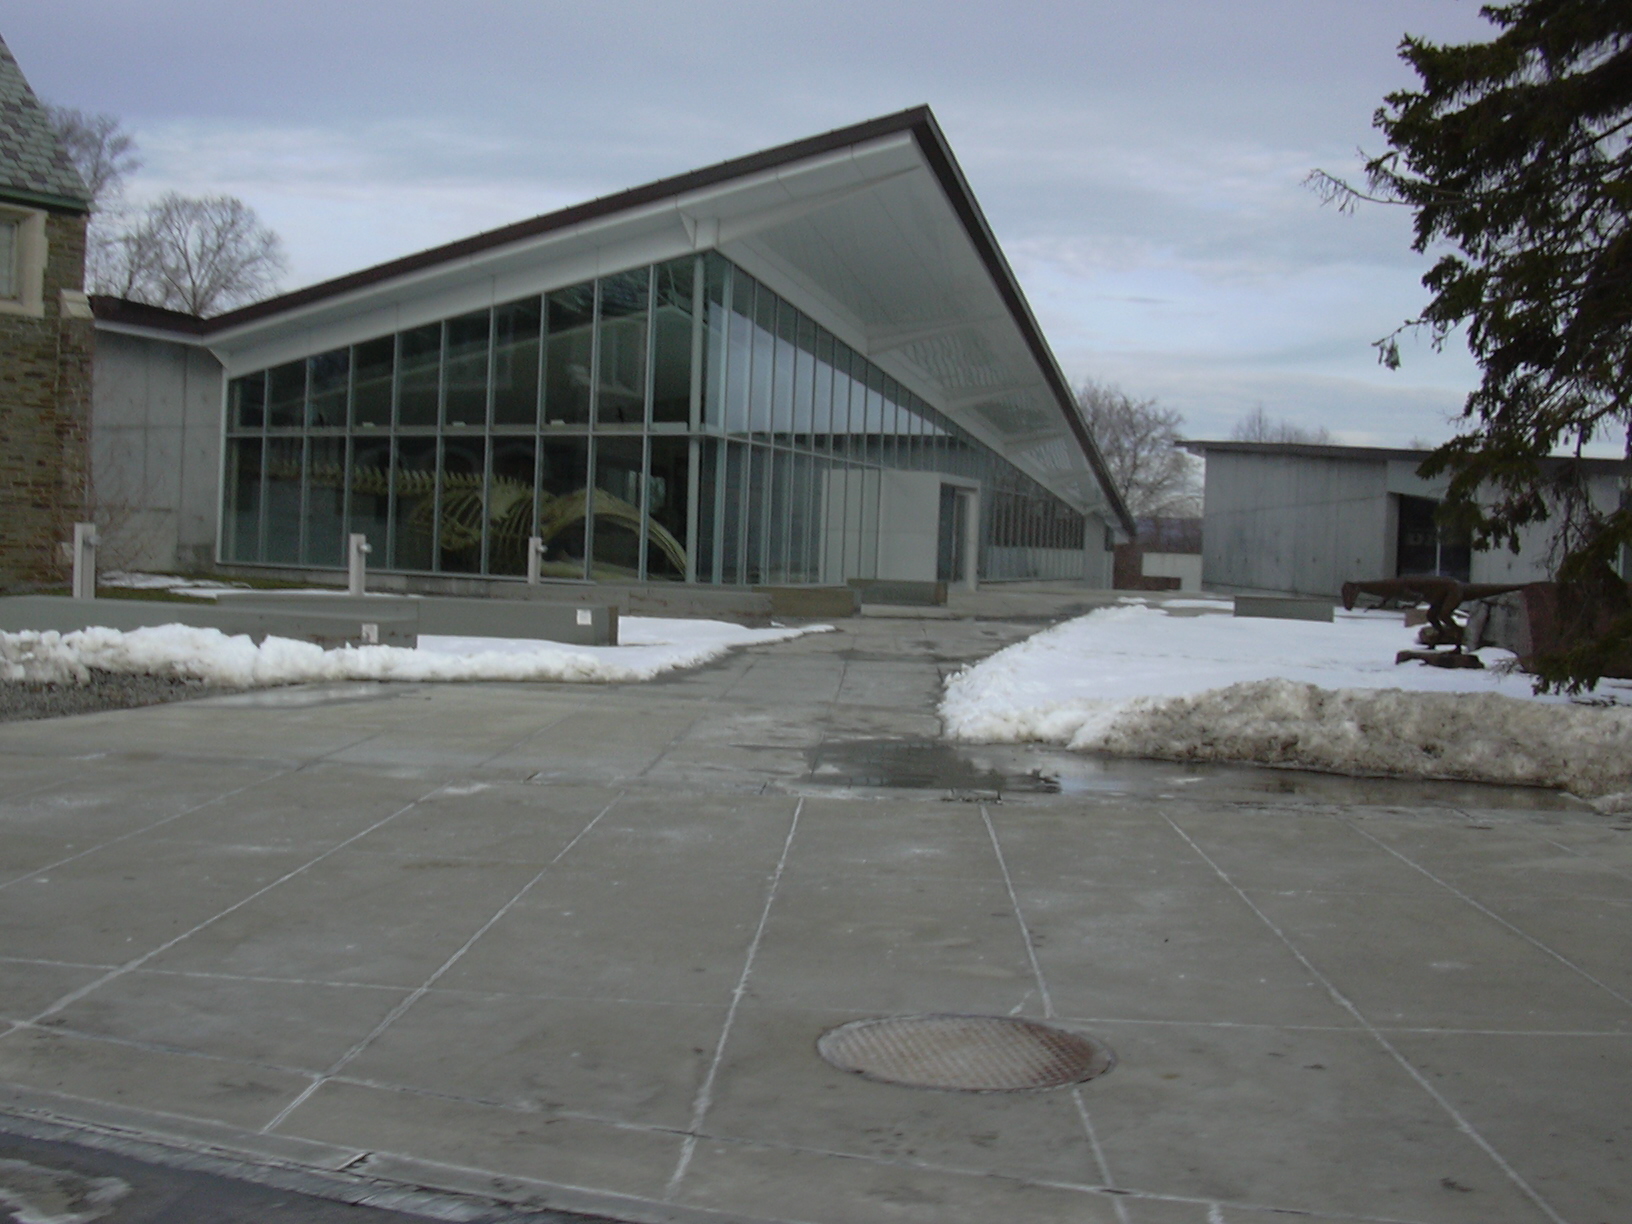
Museum of the Earth