|
Kenya Natural Disaster Profile
Basic Facts:
|
Area: 582,650
km2
Coastline:
536 km
Population:
32,021,856
|
GDP (PPP):
$33.03 billion
GDP
Per Capita: $1,000
Population Below Poverty Line:
50%
|
Natural Disaster Risk Hotspots
Click on individual images for larger
view
 |
|
 |
|
 |
| |
|
|
|
|
| Droughts |
|
Floods |
|
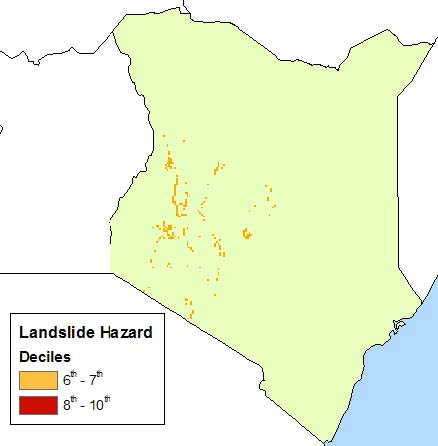
Landslides |
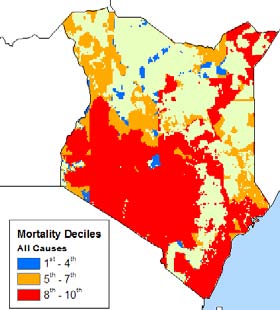
Natural Disaster Risk Hotspots (Weighted
by Mortality)
Click on individual images for larger
view
 |
|
 |
|
 |
| |
|
|
|
|
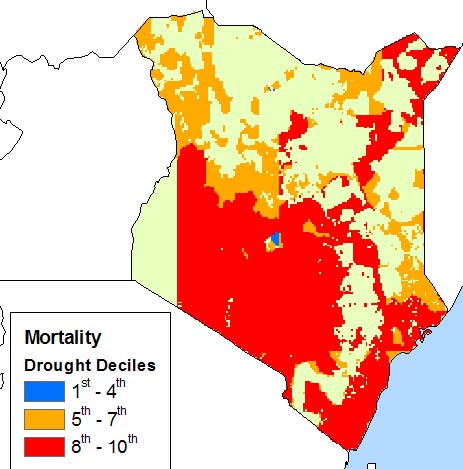
| Droughts |
|
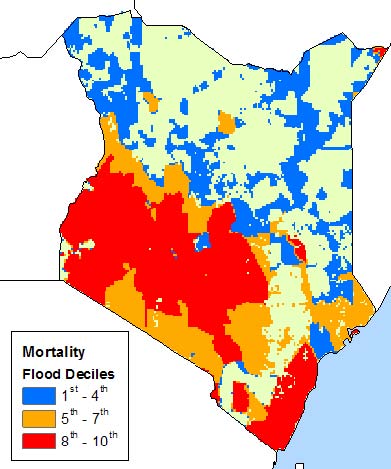
Floods |
|
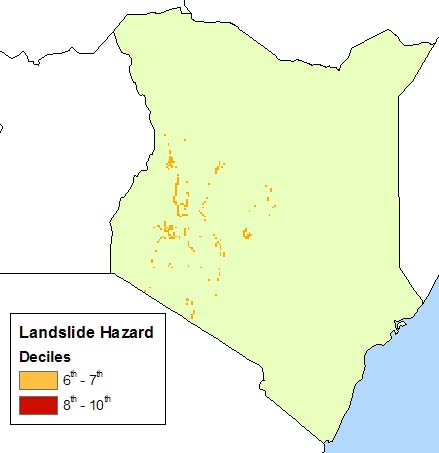
Landslides |
EM-DAT Information (1964 - 2004)
| Disaster |
# of Events |
Total Killed |
Avg. # Killed |
Total Affected |
Avg. # Affected |
| Cyclone |
1 |
50 |
50 |
0 |
0 |
| Drought |
11 |
165 |
15 |
16,312,600 |
1,482,964 |
| Earthquake |
1 |
0 |
0 |
0 |
0 |
| Flood |
17 |
524 |
31 |
1,203,508 |
70,795 |
| Volcano |
- |
- |
- |
- |
- |
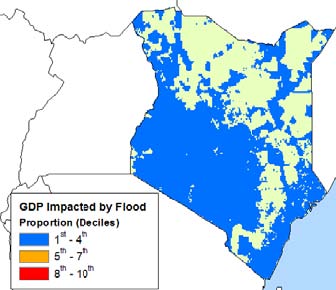
Natural Disaster Risk Hotspots (Weighted
by Proportion of GDP Impacted)
Click on individual images for larger
view
 |
|
 |
| |
|
|
| Droughts |
|
Floods |
Multi-Hazard Disaster Risk Hotspots
(All Hazards combined and weighted by Mortality and Proportion
of GDP Impacted)
Click on individual images for larger
view
 |
|
 |
| |
|
|
| Mortality |
|
GDP |
Multi-Hazard Disaster Risk Hotspots
by Hazard Groups (Top Three Deciles)
Click on individual images for larger
view
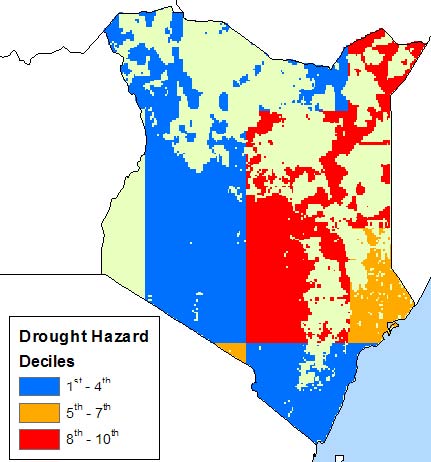
Observations
Droughts and floods are the most significant
hazards affecting Kenya. The maps exclude hazard impacts in
non-agricultural areas where small populations were masked
out of the maps. Although droughts and floods show large impacts
when weighted by mortality, the effects of droughts are more
severe, particularly in the north. When weighted by GDP impact,
droughts pose a substantially higher risk than floods throughout
the country.
|