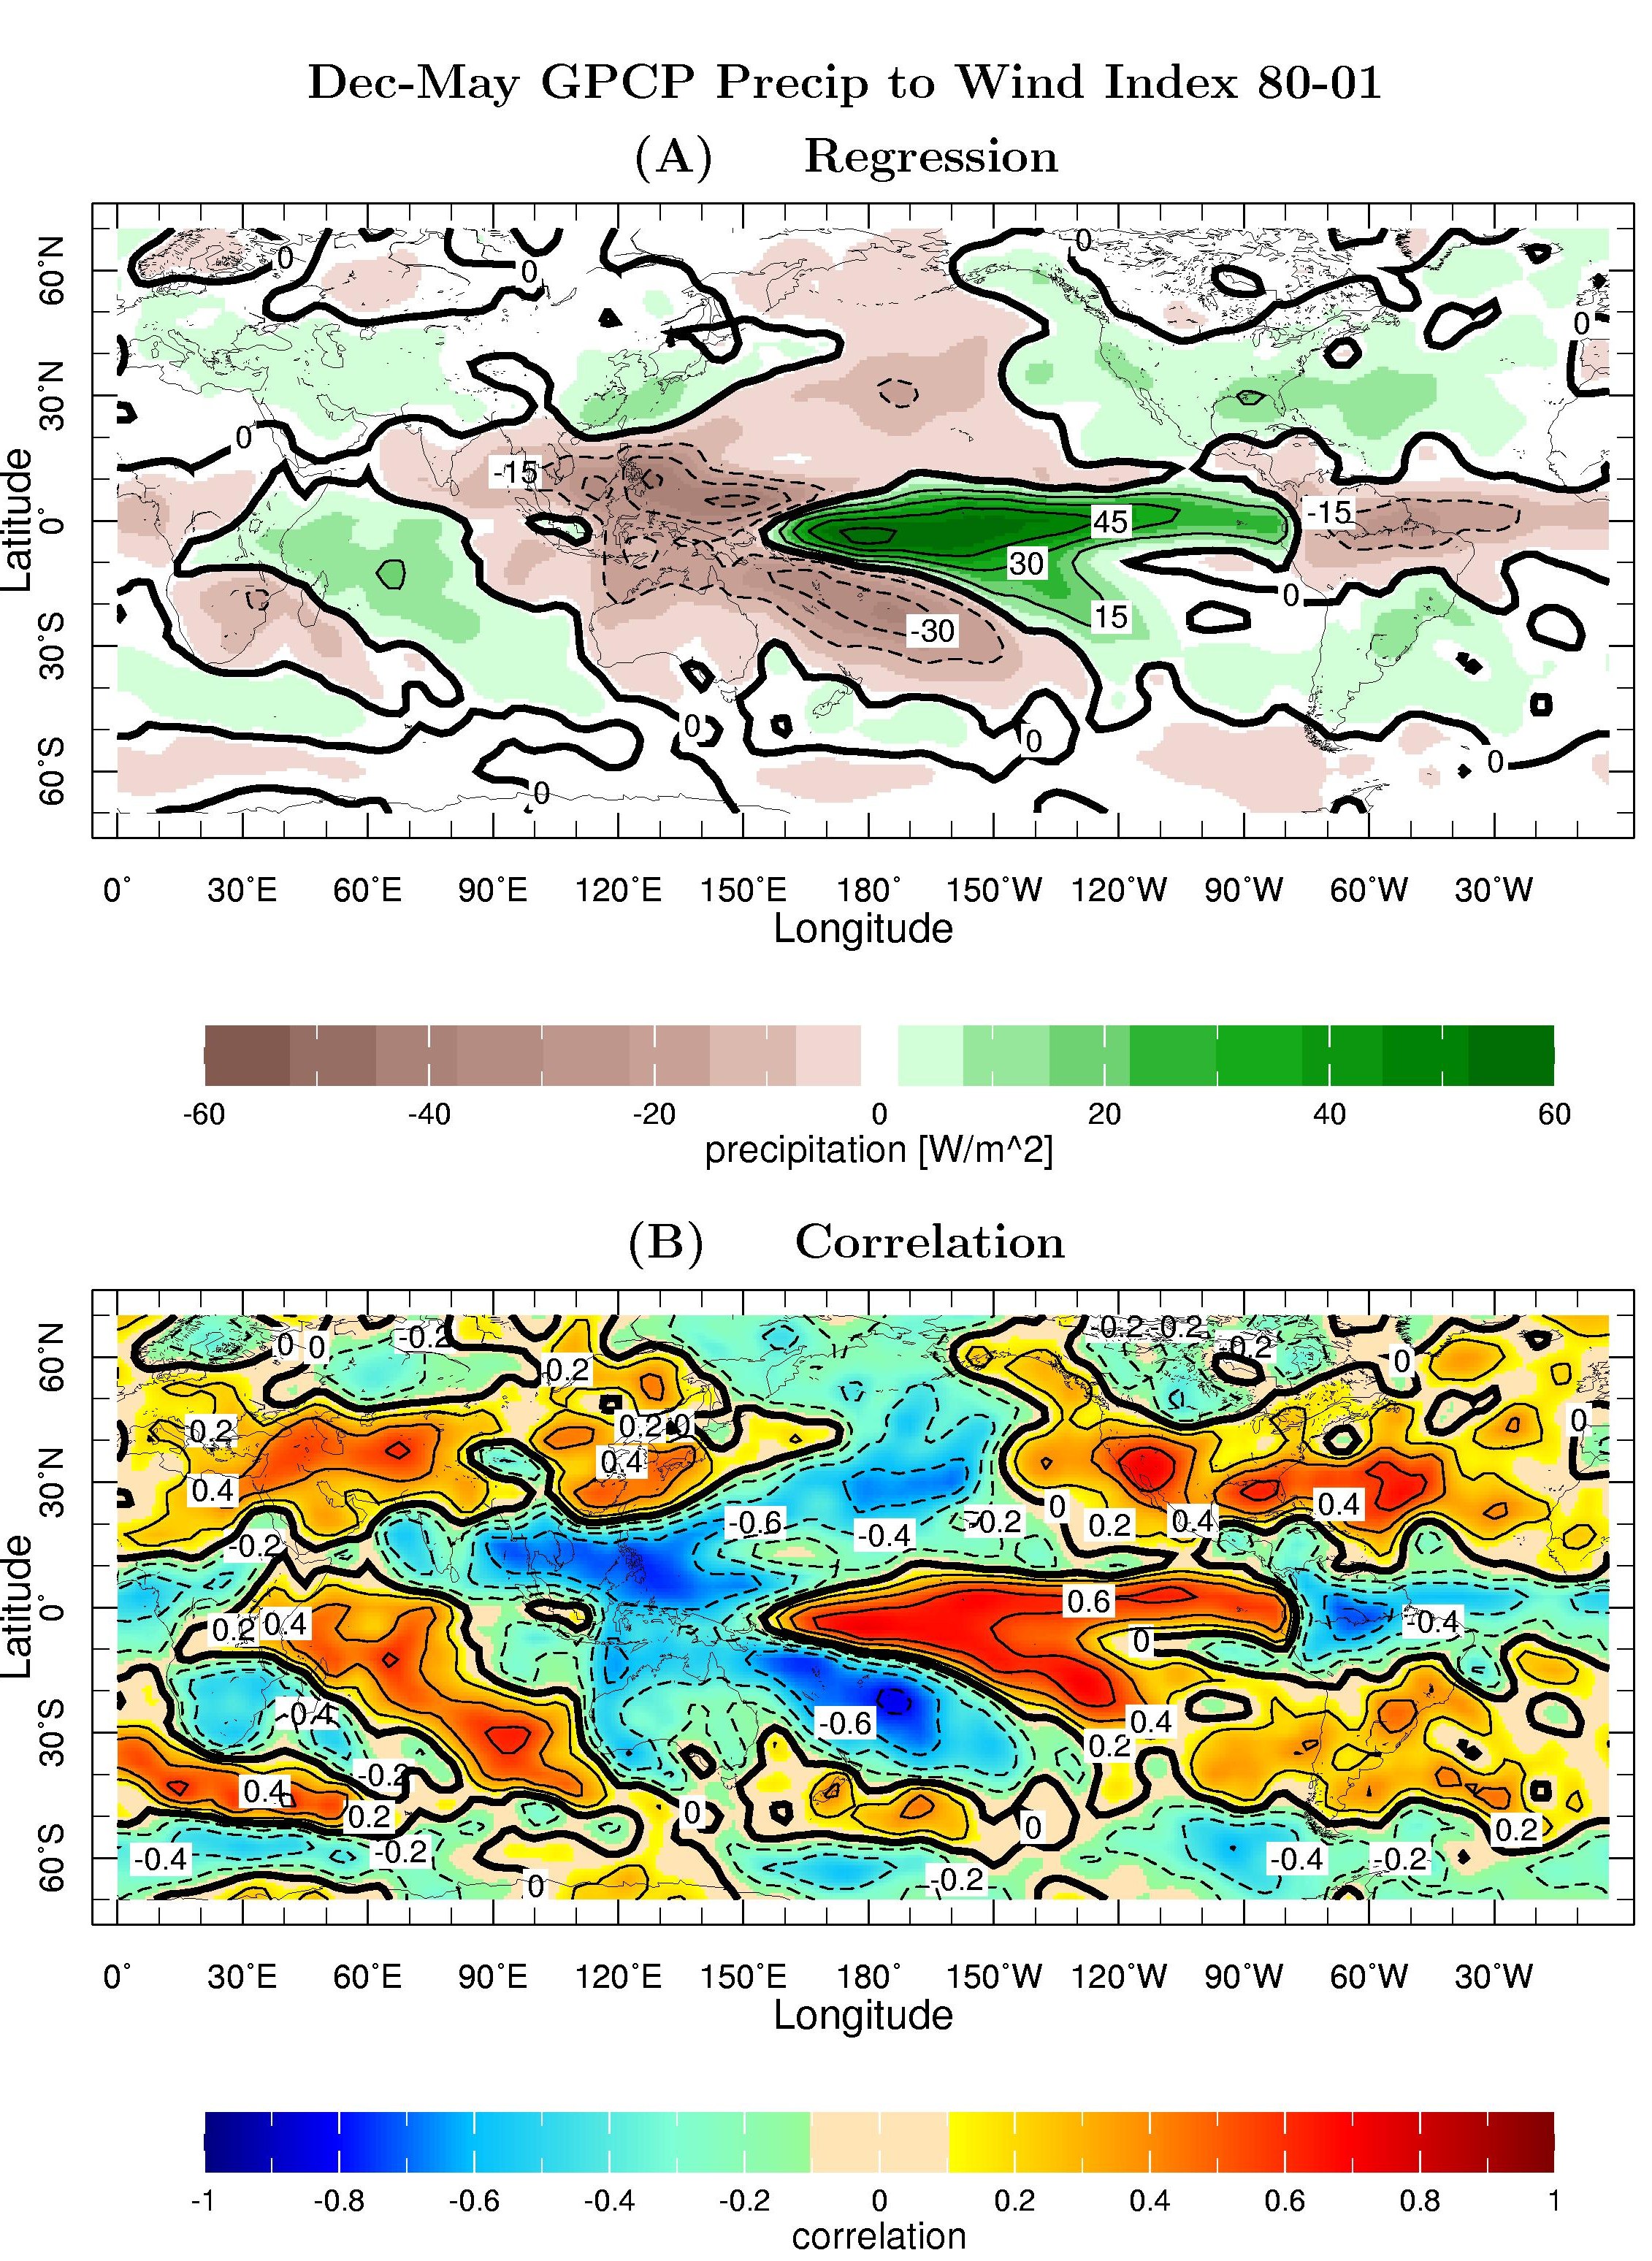
| Figure 6 |
| Top, the regression and, bottom, the correlation of the observed GPCP satellite-gauge precipitation for 1980-2001 with an index of El Nino related variability. The units in the top panel are Watts per square meter per standard deviation of the wind index. |
|
|