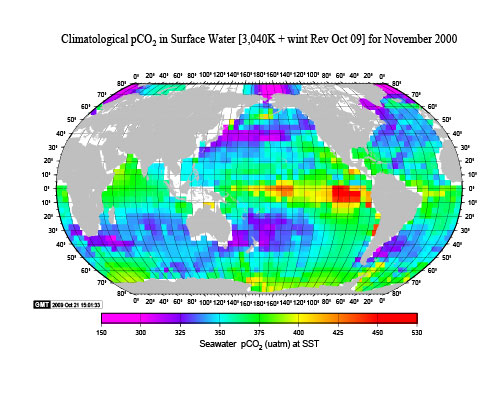
These maps show the mean pCO2 at Sea Surface Temperature for each 4°x5° Box for each of the 12 months. The values are estimated for the year 2000 and were revised in June 2009.


|
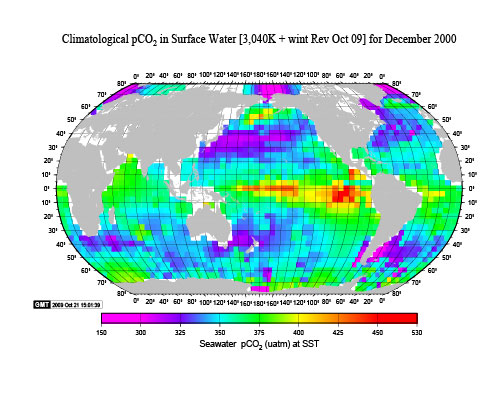
These maps show the mean pCO2 at Sea Surface Temperature for each 4°x5° Box for each of the 12 months. The values are estimated for the year 2000 and were revised in June 2009.
|
||||
|
|
|||
|
|
|||
|
|
|||
|
|
|||
|
|
|||
|
|
|||