
Ghost Hunting: Finding hidden mountains!

So how do these mountains 'measure up'?
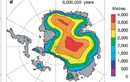
 When the Russians used dynamite to find these mountains, they had only a rough idea of how big the mountain range was and how tall some of the mountains were. Our AGAP team will be able to create a much better map of the Gamburtsevs using our 'tools of the trade'. The image above is a scientific artist's presentation of our data. Click on the image to see a larger version. So just how big is this mountain range? How does its 'footprint' measure up to the size of the state where you live? Go to 'Try the Activity'.
What's in a Layer?
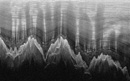
If you look at this image you can see the way the ice flows across the mountain range. (Click on the radar image to enlarge it.) Scientists can trace along 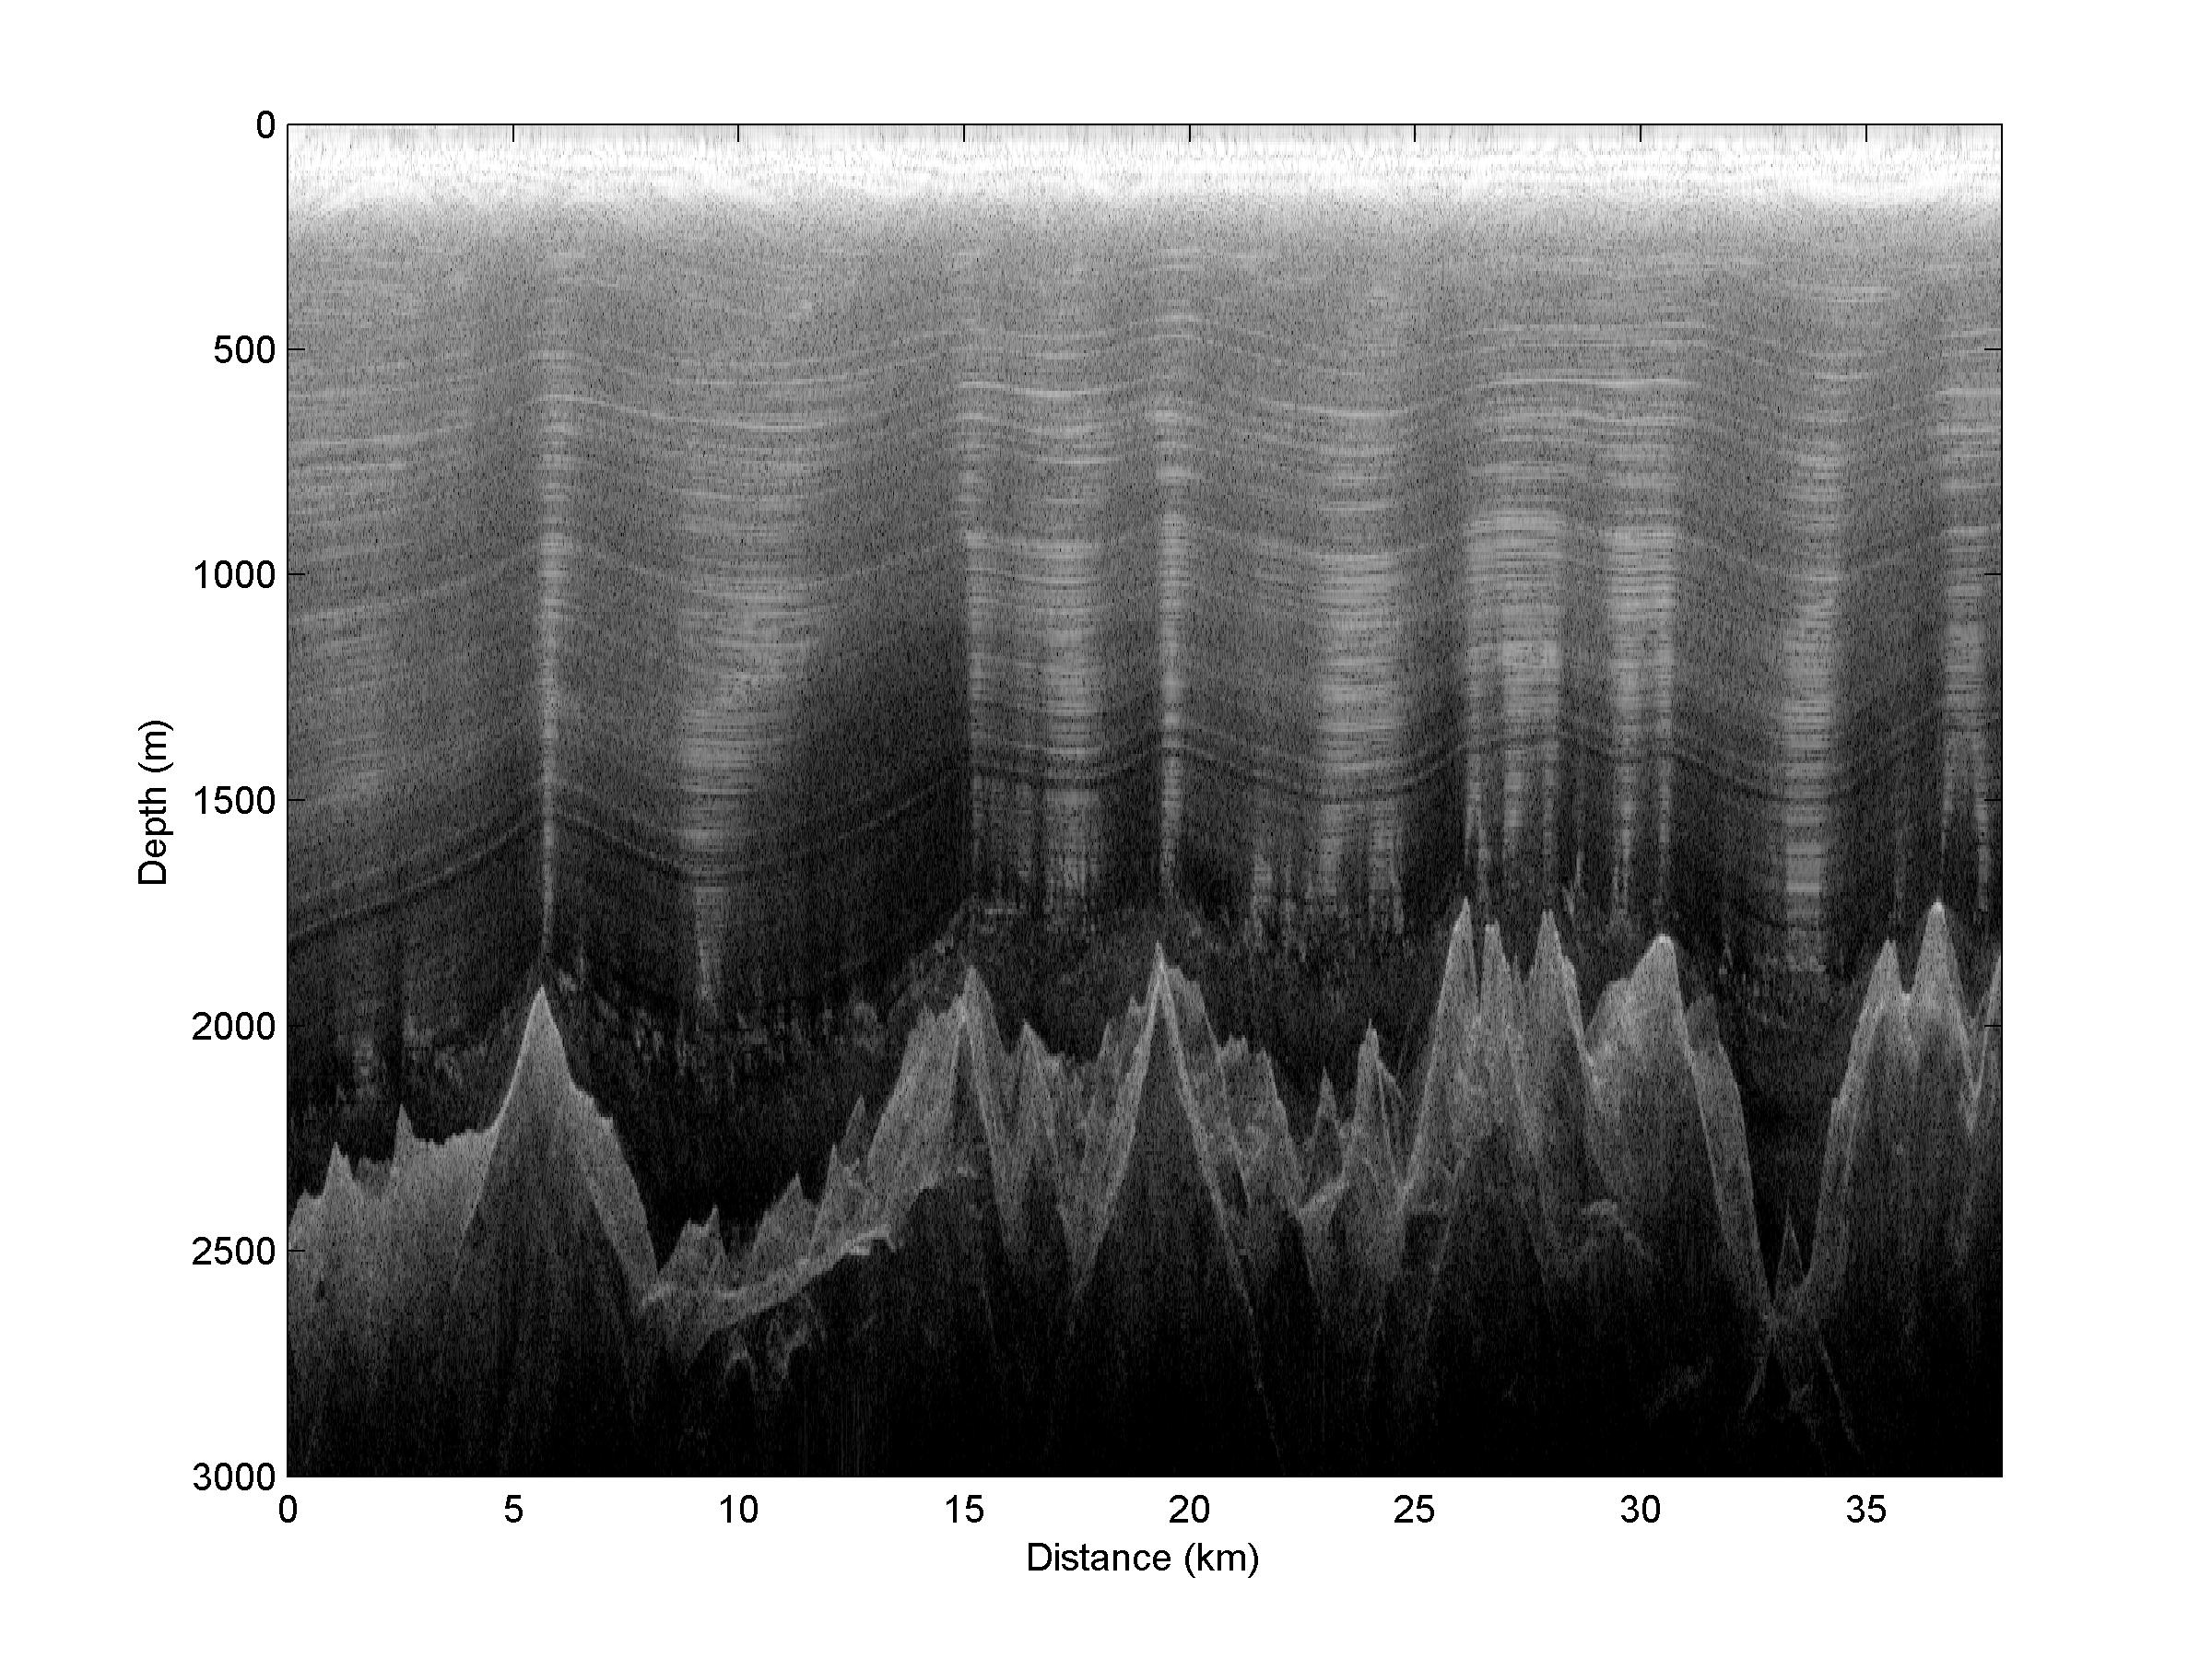 the lines to separate them by season and by year. This is easier in the upper layers when the snow is fresh and not as compressed (pushed together). Deeper down in the ice it is harder to separate the lines into individual seasons. Summer and winter snow lines show up differently. The summer snow lines generally appear darker. This is because the snow often melts a bit and refreezes causing it to become denser and appear darker. Scientists have noted that the surface under the ice has a strong influence on the ice that flows over it. When there is SO much ice it is hard to believe that this can be true. Let's see this for ourselves! Go to 'Try the Activity'.