Next _____ Prev _____ First _____ Last _____ Index _____ Exit
 |
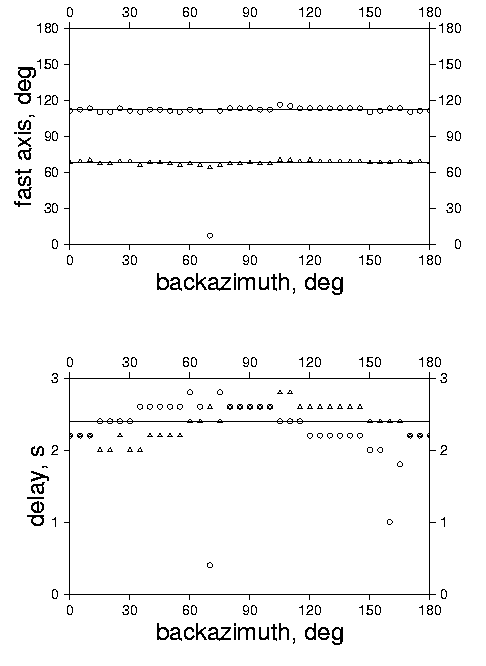
Fig. 6. Results of 2 layer fit to 2 layer synthetics. Top: Estimated fast axes for individual seismograms (circles and triangles) and group (solid lines). Bottom: Estimated splitting delay. |