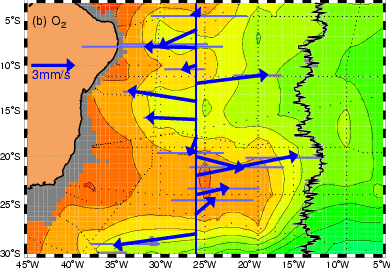

During the WOCE Deep Basin Experiment (DBE) a variety of observational data sets were collected in the Brazil Basin (western basin of the South Atlantic north of 30°S). These include Lagrangian trajectories from floats drifting at various depths, Eulerian velocity measurements from current meters, as well as hydrographic sections. A primary objective of the experiment was to observe and quantify the deep circulation within an abyssal basin.
One particular result inferred from the DBE data is that the flow at the level of North Atlantic Deep Water is primarily zonal (Hogg and Owens, DSR, 1999). Furthermore, Thurnherr and Speer (JMR, 2004) show that the temporally averaged floats measurements in the interior of the Brazil Basin are consistent with patterns in several tracer fields, as illustrated in the case of oxygen at 2500m in the figure on the right. (A hydrographic and tracer climatology of the tropical and subtropical South Atlantic can be found here.)
During the DBE, several hundred acoustically tracked neutrally buoyant floats were deployed in Antarctic Intermediate Water (AAIW, 600-1350m), North Atlantic Deep Water (NADW, 2000-3000m) and Antarctic Bottom Water (AABW, > 3000m). The DBE float data are publicly available from the WOCE Float DAC. Below, there are links to 3 gif-animations showing the float data sub-sampled every 4 days. Trajectory gaps shorter than 20 days are filled with cubic splines; the floats "disappear" during longer gaps. [Decent web browsers should be able to display the animations correctly (one full year should take 6.4s), it may be advisable to download the animations and display them using other viewers. For example, the MacOSX the QuickTime Player is a good gif-animation viewer and individual frames can be inspected with Preview.]
| AAIW float trajectories. [With tails.] | See Boebel et al. (DSR, 1999) for details. |
| NADW current-meter data and float trajectories. [With tails.] | See Hogg and Owens (DSR, 1999) for details. Velocity arrows of current meters in energetic regimes are colored orange and scaled by 1/5 (compared to yellow current meters). |
| AABW float trajectories. [With tails.] | See Hogg and Owens (DSR, 1999) for details. |
| © 2006 A.M. Thurnherr (e-mail) | created: Wed Apr 5 13:40:58 2006 | modified: Thu Apr 6 14:57:03 2006 |