|
 |
|
|---|
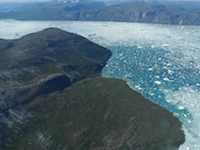
Local Fjords
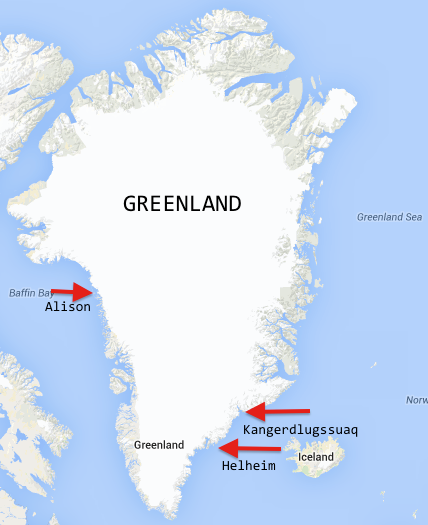
Leveraging Local Knowledge to Measure Greenland Fjords
Education & Outreach
Lamont-Doherty Earth Observatory
Education & Outreach
Mapping Temperature Activity
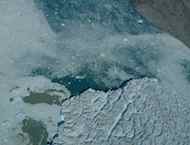
This activity has students create a map of water temperature for a Greenland fjord. Densities differences in water cause it to layer, with denser layers on the bottom and less dense layers above. Salt is the major cause of density differences in the ocean. In Greenland’s fjords the salty water comes from the oceans flowing under the fresh meltwater water flowing in from the front of the glacier. But how does this relate to temperature? and what effect might this have on the glaciers flowing into the fjords? Try this activity to see.
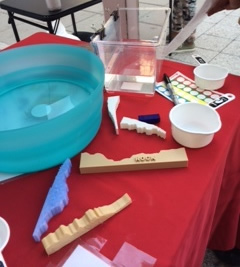
Using Physical Models in Education
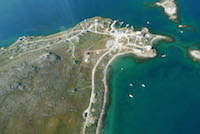
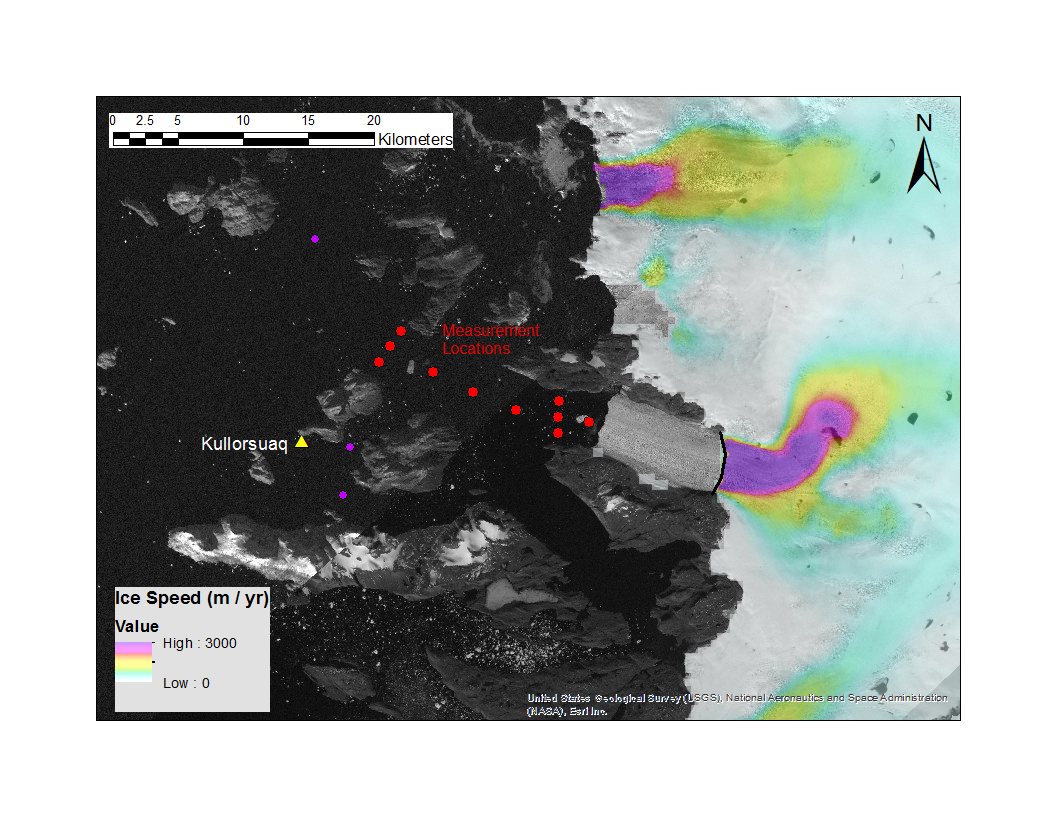
Physical models can be used to demonstrate both physical features (topography and bathymetry) as well as some of the physical processes and interactions (ocean/land, ice/land, ice/ocean).
Developing physical models from the available data on Alison glacier will build a place based connection to the educational part of the project. Through the project research our goal is to add to the available data, including bringing in local knowledge to help expand our understanding of Alison glacier and improve the model.
 |
 |
|---|---|
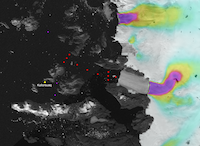
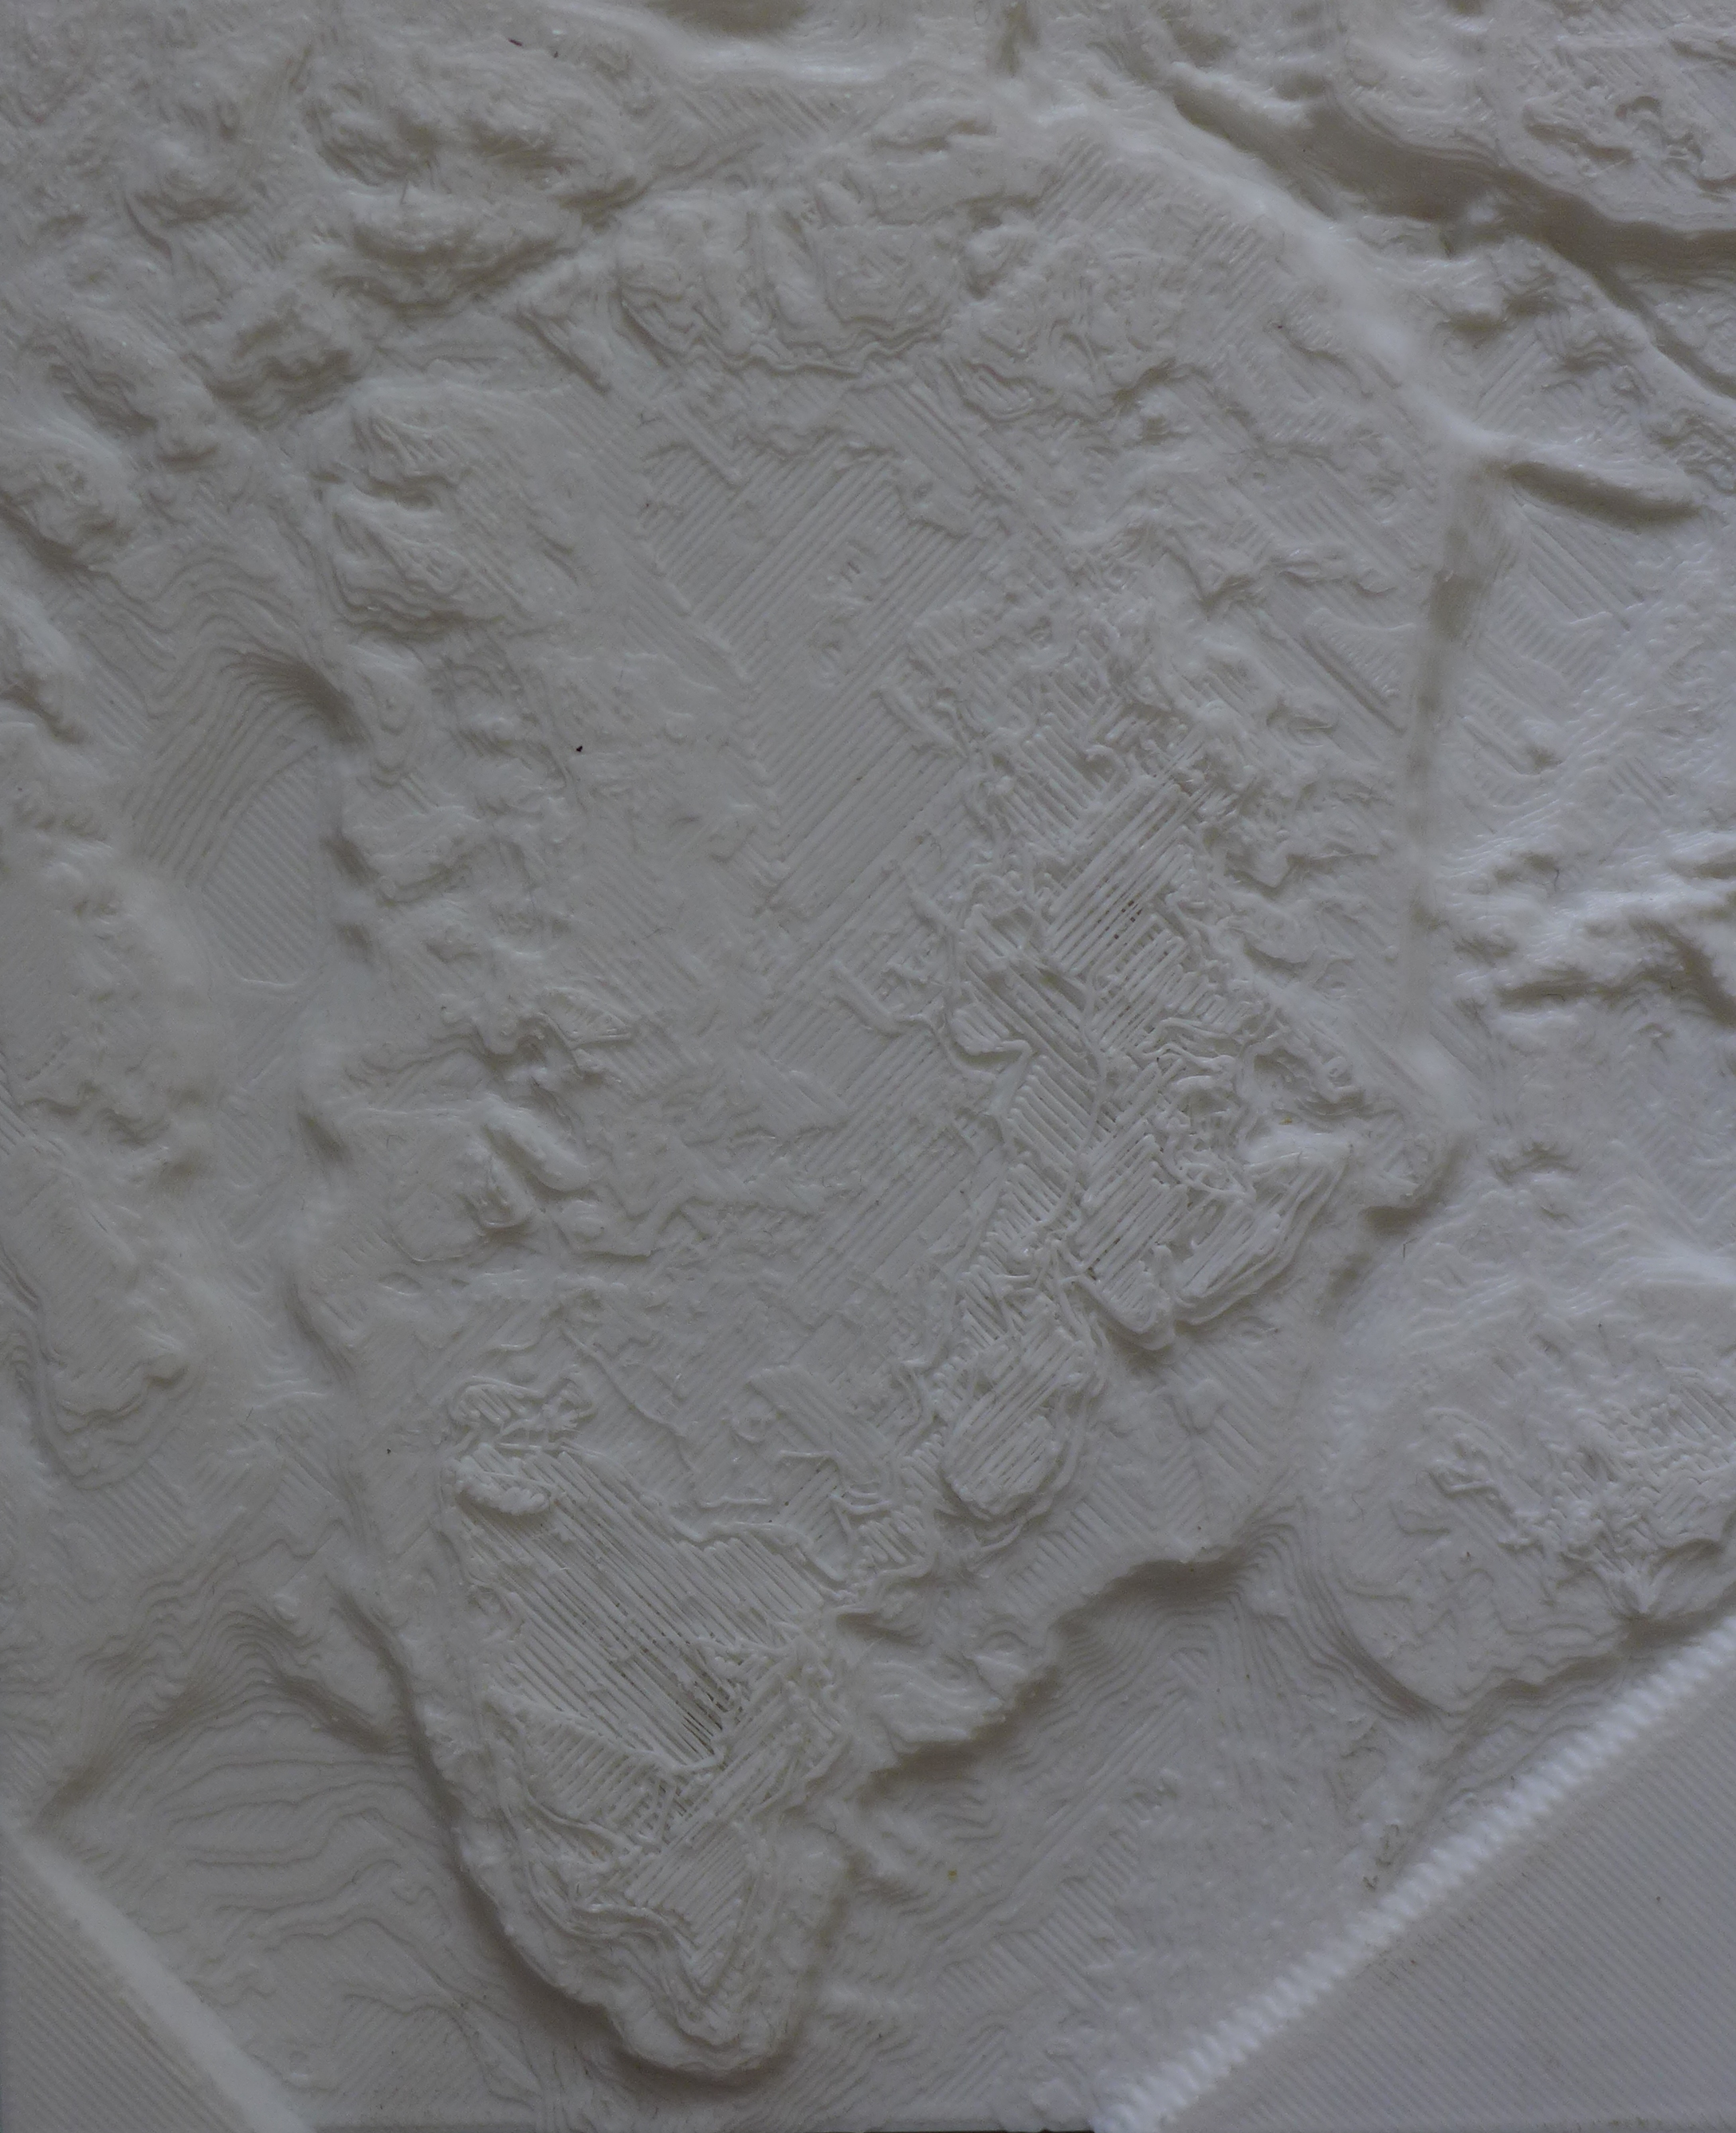
| Physical models are used as instructional tools to demonstrate the bathymetry of the Greenland fjords, glacial flow, and ice and ocean interactions. | Physical model of the surface of Greenland with wider study area circled. Physical models can illuminate deep troughs where warm ocean water can connect with the ice as well as general high and low areas. Click on the image to enlarge. |
![]()
This project is funded through Lamont Climate Center with additional funding from NASA Interdisciplinary Program & logistical support from NSF. | contact us | web master