A histogram is a graph that
counts the number of occurrences of data points in a series of ranges.
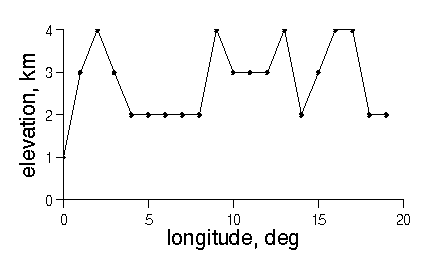
Consider the following topographic profile consisting of 20 elevation values:

Note that the twenty data fall between 0 and 5 km elevation. To make a histogram, we count up the number of data between 0.5 and 1.5 km, between 1.5 and 2.5 km, and so forth:
| elevation
range |
number of
elevation points |
|---|---|
| 0.5-1.5 | 1 |
| 1.5-2.5 | 8 |
| 2.5-3.5 | 6 |
| 3.5-4.5 | 5 |
The graph of this table is the histogram:

The peak in the histogram identifies the elevation range that occurs most often in the data. Note that the graph has been plotted as a series of rectangles, to suggest the 'binning' process that occurs when the elevation data are counted. These rectangles are often omitted when the number of elevation ranges is large (since it makes the graph very messy). The resulting graph then looks like:
