| Previous |
3.2. CLIMATE, ASTRONOMICAL FORCING, AND CHAOS
3.2.1. Introduction
Fundamental to what we feel are some of the potential breakthroughs that may be realized by a Pangean coring transect is the record of Milankovitch cyclostratigraphy preserved in the Triassic-Jurassic basins. Because the underlying celestial mechanics is relatively arcane, but necessary for the understanding of the science issues, and the geological record has potential to help constrain celestial mechanical issues, a short review of the relevant concepts is presented here. More in-depth treatments, from which this is derived, can be found in Laskar (1990, 1999), Laskar et. al. (1993), Berger et. al. (1992), Berger and Loutre (1990, 1994) and Hinnov (2000).
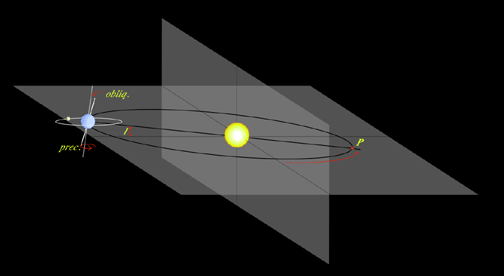
Figure 3.2.1.1. Simplified geometry of the Earth's orbit for paleoclimate. The orbit of the Earth is shown here in a simplified perspective drawing. The horizontal gray plane contains the Earth's orbital plance at an arbitary date and comprises the reference plane. Click for a more detailed view. Abbreviations are: prec., general precession (wobble) of the Earth's rotational axis; obliq., obliquity of the Earth's axis (tilt); I, inclination of the plane of the Earth's orbit relative to the reference frame; P, point of perihelion. Click on the image to see a higher resolution image.
Origin of the Important Climatic Frequencies
Studies of the sedimentary record of orbital change has depended largely on comparison of data from the geological record with a target model, derived from celestial mechanics, often a time series of the amount of sunlight reaching the top of the atmosphere at a particular location (insolation) or a representation of some general aspect of celestial mechanics directly related to insolation (e.g. precession index). The Earth's axis of rotation and the figure of the Earth's orbit are perturbed by the gravitational attraction of the other bodies in the Solar System with an amplitude related to the mass of the bodies and their distance from the Earth. These perturbations produce cycles in insolation, which in turn effects climate. Models of the behavior these perturbations in frequency and time are generated by a three-step process.
1) The analysis of the mutual gravitational interactions and time behavior of the components of the Solar System is an n-body problem and its behavior though time cannot be solved analytically. Instead is usually studied by numerical integration (Quinn et al., 1991), or with a combination of analytically and numerical methods as in Laskar et al. (1993). The numerical integration of the bodies of the Solar System is difficult and requires minimization of error of the observational data for the present as well as considerable finesse in setting up and running on supercomputers.
| 2) The results of the numerical integration are
described by Fourier analysis and summarized as a series of frequencies,
phases, and amplitudes representing the periodic behavior of each of the
planets
(Table 3.2.1.1). These frequencies are split into two classes representing
the behavior of the planets in two orthogonal views (Fig. 3.2.1.1). The
"g" frequencies are those of the planets viewed downward on a fixed plane
of the orbit of the Earth (at an arbitrary date) with its specific orbital
orientation and shape. These frequencies reflect the change in the eccentricity
and orientation of the figure of the orbits. The other, the "s" frequencies,
are those viewed parallel to the reference plane (Fig. 3.2.1.1) and reflect
changes in the inclinations of the planes of the planetary orbits relative
to that plane. It is the rocking of the plane of the Earth's orbit relative
to the reference frame that produces the so-called "obliquity cycle" that
averages 41 ky. For the Earth, the other main frequency that is important
is that of the precession of the Earth's axis. This is the familiar wobble
of the axis caused by the pull of both the Moon and the Sun (with similar
amplitudes) on the equatorial bulge of the Earth. Relative to the reference
plane the Earth's axis describes a circle with a period of 25,700 years.
Described as frequency (1/25,700) this is the precessional constant (p).
3) Combinations of sums the
g and s frequencies with p (i.e. p + gi and p + si)
yield the various frequencies of "climatic precession" and "obliquity".
While the precession constant is (1/25,700), these addition of the relatively
small g frequencies to the relatively large p frequency results is a slightly
larger frequency, the inverse of which is a slightly smaller period.
|
NOTE The combinations of the fundamental
frequencies
|
||||||||||||||||||||||||||||||||||||||||||||||||||||||||||||||||||||||||||||||||||||||||||||||||||||||||||||||||||||||||||||||||||||||||||||||||||||||||||||
| Table 1: Origin of present values of Eccentricity cycles based on the fundamental frequencies of the planets. |
|
The average of most of these is 21
ky. The s frequencies are negative numbers that vary less than the g frequencies,
and their addition to the p results in frequencies that are somewhat smaller
than p. The inverse of the s plus p frequencies are hence larger than p,
with most lying close to 41 ky. The g plus p and s plus p frequencies are
shown in Table 3.2.1.2.
Combinations of differences of the individual g frequencies result in the frequencies of the "eccentricity cycles". These are the modulators of climatic precession cycles and are algebraically and physically equivalent to "beat" cycles of the various climatic precession cycles, themselves. Thus, the 404 ky eccentricity cycle, very important for this workshop, is derived from g2-g5 = 1/404 = (g2 + p) - (g5 + p). Because they are the difference of very small frequencies, their periods are long relative to those of climatic precession. |
|||||||||||||||||||||||||||
| Table 3.2.1.2: Origin of the Cycles of Climatic Precession. |
Combinations of differences of the individual s frequencies result in a parallel series of modulators of obliquity that, until the last couple of years (e.g. Lourens and Hilgen, 1997; Hinnov, 2000), have received almost no paleoclimatic attention at all. Although these combinations of g, and p are the most important to the behavior of the Earth climate, there are many more combinations of g and s frequencies together which are needed for a full model of the time and frequency behavior of insolation.
Constraining Celestial Mechanical Chaos with Geological Data
The limit of the precision of the data going into the numerical integration produce large variations in the output over various times scales. This results in a chaotic drift in the values of the g and s frequencies over tens to hundreds of millions of years within a specifiable chaotic region (see Laskar, this report). This chaotic behavior makes it impossible to produce an insolation curve for more than about 20 million years into the past (or future), and indeed makes it impossible to predict the value for the longest period modulators of precession and obliquity. In fact, for 200 million years ago there can be as much as a 40% difference between extreme possibilities in the periods of the beats between some of the combinations of g frequencies within their chaotic zones.
It very important to note that the precession "constant" p also evolves though time as a consequence of tidal and climate friction from the gravitational attraction of the moon, as well as changes the geophysical properties of the Earth itself. However, although this can modeled, geological data are still required for the value of p to be specified with precession in the distant geological past (Neron de Surgy and Laskar, 1997; Berger et al., 1992; Hinnov, 2000).
However, the fact that most of the
frequencies thought to be important to paleoclimate studies are derived
from combinations of a relatively few fundamental frequencies is a very
powerful potential tool for getting celestial mechanical information directly
out the geological record. Using a time scale derived by tuning to the
most stable of the eccentricity cycles, the 404 ky cycle (see Laskar, this
report, and Olsen, this report) the other long eccentricity cycles can
be identified and their component g frequencies solved for (e. g. Olsen
and Kent, 1999a). The very long length of the Newark basin and other Triassic-Jurassic
basin cyclical records makes it possible to see such long cycles, and because
of this it is possible to determine the fundamental periods. A similar
procedure could be used for the obliquity cycle modulators. Because the
eccentricity cycles and obliquity modulators are linked (see Laskar, this
report), results from cores recovered in tropical regions where precision
is dominant (i.e. the Newark basin cores), make predictions for the obliquity
signal that can be tested by cores containing a strong obliquity response,
most likely from the high latitudes. The geological record can this constrain
celestial mechanical values for the past. Finally, by extending the procedure
outlined above, it may be possible to obtain the phases and even amplitudes
of the g and s values for the Triassic-Jurassic eventually allowing the
construction of an insolation curve for the Earth Mesozoic.
| Previous |