Submitted to Physics of the Earth and Planetary Interiors - December 1996
Revised August 1997
Accepted December 1997
Published 1998 (v.108,pp 131-143)
Abstract
Long-term observations of seismic activity and ground deformation at
mid-ocean ridges and submarine volcanoes are required for an understanding
of the spatial and temporal characteristics of magma transport and
intrusion.
To make precise records of tilt on the seafloor we have installed short
baseline tiltmeters in 6 ocean bottom seismometers (TILT-OBS) and developed
a long baseline (100-500m) two-fluid tiltmeter (LBT).
In the TILT-OBS, the seismometer platform is leveled to better than
one degree after deployment. The tiltmeter consists of a pair of
electrolytic bubble sensors mounted on a secondary leveling stage on the
seismometer platform. The leveling stage uses two motor-driven micrometers
on a triangular mounting plate to bring the sensors to null. The
sensitivity of these tiltmeters is 0.05 microradian, at a dynamic range
of 0.2 milliradian.
A long baseline instrument was developed to achieve a better spatial
average of deformation. Most approaches used on land to measure stable
long baseline tilt cannot be applied to a submarine instrument, but tiltmeters
in which the pressure of a fluid in tubes is measured are amenable to
installation
on the seafloor. The development resulted in a device that is essentially
a center-pressure instrument folded back on itself, with fluids of different
densities in the two tubes.
During July to September 1994, these instruments were deployed on Axial
Seamount, on the Juan de Fuca ridge off Washington state, for a test of
their relative performance on volcanic terrain, yielding 9 weeks of continuous
data (seismic, tilt, temperature) from 5 TILT-OBS and one long baseline
instrument. Drift on all instruments was of the order of 1 microradian
per day, with higher frequency variations of order 5-10 microradian.
Initial drift on the TILT-OBS is shown to be associated with platform settling
rather than with the sensor or its mounting. High frequency noise
is coherent across instruments and tidal in character, and we conclude
that tidal currents moving the sensors are responsible.
Keywords: Short & Long Baseline Tiltmeters, Axial Seamount.
Introduction
Mid-Ocean Ridge (MOR) volcanoes are volumetrically the most important
type of volcano on Earth yet our understanding of MOR volcanoes is still
in its infancy when compared to the extent of knowledge acquired
on subaerially exposed active volcanoes like Kilauea/Hawaii, or
Krafla/Iceland.
Most of what we have learned about the dynamics and intrusive geometries
of subaerial volcanoes comes from detailed monitoring programs carried
out continuously over decades of diverse volcanic and intrusive activity
[e.g. Decker, 1987]. The most successful observatory programs
on subaerial volcanoes involve seismic monitoring and deformation, neither
of which has been systematically applied to MOR volcanoes over significant
time periods. We need similar long-term monitoring of MOR volcanoes
before we can understand fully their emplacement and chemical fractionation
behavior, or the mechanisms of chemical ridge segmentation.
Experience from subaerial volcanoes shows that detailed monitoring
programs provide independent constraints on the geometry, sizes, and dynamics
of diverse magma reservoirs and feeders. At Kilauea volcano, for
example, interpretation of petrological data was effectively guided by
knowledge of the geometry and interconnectedness of feeder systems
[e.g. Wolfe et al., 1987]. At MORs, however, few monitoring data
are available, and the chemical and petrological data themselves have to
be used to infer the physics of the magma supply systems [e.g. Langmuir
et al., 1986]. The latter approach is typically non-unique and
necessarily results in highly speculative models. Even though studies
of ophiolites do provide important structural constraints, in particular
the dominance of intrusive rocks, so far they fail to provide unique
interpretations
of magma chamber geometries, and they are not suited for studies
of intrusive dynamics.
In Figure 1 [from Decker, 1987], we show
the tilt record of the Uwekahuna vault at the Hawaii Volcano Observatory
(HVO) located on the Kilauea caldera rim. This 30 year record typically
displays steady rises over several months with sudden drops. This
behavior is interpreted as slow inflation of a shallow magma chamber and
catastrophic deflation, usually by eruption. The apparent increase
in "noise" in the January 1984 to July 1985 record is caused by
approximately
monthly 10-20 microradian cycles with steady tilt increases and sudden
drops, perfectly mimicking the 21 eruption cycles observed in this time
period at Puu Oo on the Kilauea East Rift, 20 km SE of Uwekahuna
vault. These observations clearly show that the timing of eruptive
and intrusive events is well reflected in the measurement of tilt.
The intrusive geometry of sheeted dikes and the dynamics of their
emplacement
at MORs is probably one of the major open structural problems in
marine geology. Currently, there is no consensus about the direction
of sheeted dike emplacement. Sheeted dikes are traditionally thought
to intrude vertically [e.g. Cann, 1970; Kidd and Cann, 1974; Kidd, 1977],
reflecting the passive upwelling of magma as a direct consequence of ocean
floor spreading. However, there are several arguments which may be
advanced in favor of lateral dike emplacement at mid-ocean ridges.
In particular, theoretical considerations and in situ observations on subaerial
volcanoes in Iceland and Hawaii [e.g. Sigurdsson and Sparks, 1978; Sigurdsson,
1987; Rubin and Pollard, 1987; Okamura et al., 1988] suggest that lateral
propagation of sheeted dikes may occur in at least some MOR settings.
Subsequent to predictions by Baragar et al. [1987] and Sigurdsson [1987],
recent studies of sheeted dike emplacement processes in the Troodos ophiolite
[Varga et al., 1991; Staudigel et al., 1992] showed that dike intrusive
directions are certainly not exclusively vertically upward, and horizontal
directions are common. Radial outward intrusion of sheeted dikes
into the merging rift zones of MOR volcanoes cannot be distinguished from
vertically upward intrusion any other way than through monitoring of the
intrusive behavior of submarine volcanoes.
The deformation of the host rock in response to magma intrusion may
be brittle or elastic, with or without the release of significant seismic
energy. The recent ability to use military hydrophone arrays (SOSUS)
has already proven extremely valuable for our understanding of mid-ocean
ridge tectonic behavior [e.g. Fox et al. 1993a; Fox 1995]. However,
this only provides information on deformation associated with a high level
of seismicity. It is still not known how important aseismic deformation
and magma transport are in mid-ocean ridge processes.
Ocean Bottom Tiltmeters for Submarine Volcano Monitoring
Among the instruments used for surface deformation measurements, only
a few can be adapted to underwater operation. Several types are under
development; absolute pressure gauges for vertical displacements (e.g.
Cox/SIO; Fox/NOAA [Fox 1990b, 1993b]), acoustic extensiometers (e.g. Spiess/SIO;
Normark/Morton USGS; Embley/Chadwick/NOAA) and several tiltmeters
(Constable/Wyatt/Orcutt/Staudigel
SIO; Chave/WHOI; Duennebier/HIG; Fox/NOAA; Stakes/MBARI). In addition
to this list, Zumberge at SIO has new programs for both vertical displacements
through absolute gravity measurements and a fiber-optic extensiometer.
Several approaches have been used in the development of submarine short
baseline tiltmeters (SBT). Sakata and Shimada [1984] and Shimamura
and Kanazawa [1988] developed tools that were emplaced as fixtures in relatively
shallow water. A number of other parallel efforts to develop re-deployable
SBTs are underway. F. Duennebier of HIG reported a shallow water deployment
of a tilt meter in an OBS [Duennebier and Harris, 1990] and C. Fox of NOAA
reported that he is developing tiltmeters for a volcanic event identification
system [Fox 1990a]. D. Stakes of MBARI is developing a borehole tiltmeter
(pers. comm.), and A. Chave of WHOI is developing a short-baseline instrument
(pers. comm.). Our efforts in SBT development are discussed in Staudigel
et al. [1991], Willoughby et al. [1993] and Wyatt et al. [1996], and LBT
development is summarized in Anderson et al. [1997]. While it is
relatively simple to equip any seafloor instrument, such as a magnetometer
or ocean bottom seismometer (OBS), with some form of inclinometer, our
efforts have been to develop a tiltmeter with drift rates which are small
compared with the expected volcanic signals. Volcanic deflation events,
seen prior to and during eruptions and during re-distribution of magma
between reservoirs, have tilt rates which exceed tens of microradians per
day, but inflation events can be as low as a few microradians per month.
Our goal, therefore, is to attain this level (microradians/month) of stability,
appropriate for volcanic monitoring, and we are very close to this.
While these values are still orders of magnitude larger than non-volcanic
tectonic tilt observed by long baseline tiltmeters on land, they are orders
of magnitude smaller than have so far been observed on the seafloor.
Short Baseline Tiltmeter
Our initial objective was to develop a portable submarine tiltmeter
and to provide benchmark measurements of submarine tilt at a number of
sites. Tiltmeters were added to the 6 existing Scripps Ocean Bottom
Seismographs (OBS) [Willoughby et al. 1993] to provide an instrument package
that essentially has all the benefits of an OBS, with the added advantage
of tilt measurement (TILT-OBS). Figure
2 shows a cross-section of a TILT-OBS and illustrates the location
of the tiltmeters and inclinometers. The TILT-OBS is probably best
compared to the portable tiltmeters and seismometers as they are commonly
used to monitor subaerial volcanoes. These instruments have an obvious
application for reconnaissance and as rapidly deployed first-order research
tools during, or subsequent to, major eruptive phases or intrusive events.
However, the lack of precipitation and isothermal seafloor environment,
(the presence and variations of which are significant sources of noise
on land tiltmeters), will probably allow observatory quality measurements
to be made on decadal time scales using such a short-baseline instrument.
The TILT-OBS is designed to monitor ground tilt which may vary in volcanic
terrain anywhere from sub-microradian to several milliradian and to cope
with deployment angles which may vary by tens of degrees as a result of
the free-fall emplacement procedure. Several tilt sensors are set to different
gains to assure coverage of the full dynamic range with adequate sensitivity.
Two orthogonally mounted inclinometers (Shaevitz/02338-03) are run at very
low gain (538 microradian sensitivity, +/- 1 radian dynamic range)
and are attached to the equatorial ring of the OBS to monitor capsule
inclination
and gross tilts; these operate independently of the leveling mechanisms.
Two other orthogonal inclinometers are run at higher gain, set at 10.8
microradian sensitivity with 44 milliradian dynamic range and are mounted
on the seismometer block to measure platform tilt, and to provide some
redundancy for the tiltmeters. The dynamic range of these inclinometers
is set to accommodate the range of inclinations provided by the seismometer
leveling (better than 9 milliradian). Finally, a pair of high sensitivity
tiltmeters using electrolytic bubble sensors (distributed by Fredericks
Company) are mounted on a secondary leveling stage. This leveling
stage uses two motor-driven micrometers on a triangular mounting plate
to bring the sensors to null once the package is on the seafloor. The present
sensitivity of these tiltmeters is 0.05 microradian, at a dynamic range
of 0.2 milliradian, although an auto releveling routine expands this
further:
The tiltmeters can be preset to relevel for any desired time during an
experiment. This ensures that they do not go, or remain, off-scale
due to either drift, instrument settling or tilt signal. This releveling
scheme is very unlikely to result in an event being missed altogether,
because with multiple instruments, the releveling would be staggered.
Since the time at which the relevels are performed is predetermined and
carefully recorded, we can remove these intervals from the final data,
thereby eliminating the risk that they would be mistaken for a tilt event.
All inclinometer and tiltmeter functions, the leveling, and the data recording,
are controlled by the OBS's Central Processing Unit. To reduce power
consumption, the inclinometers and tiltmeters are turned on and off for
each measurement. 15 minutes is allowed for warm-up, to avoid problems
with sensor drift/noise that can be associated with switching sensors on
and off. The sample interval can be varied to fit the experiment
objectives, depending on whether short or long term signals or both are
of interest.
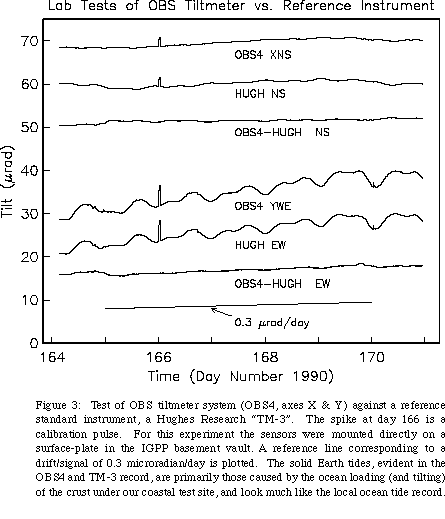
When 'deployed' on a concrete pier inside a test vault the tilt sensors
comfortably track the same 3 microradian peak-to-peak Earth-tide tilt signal
as measured by a reference instrument (Figure
3). (These tides are some 30 times larger than normal owing to
ocean loading near the vault.). The first successful wet test of
the first two of these TILT-OBSs was conducted on sediments on the eastern
North American continental shelf. After an initial settling period
of about ten days characterized by rates of 20 microradian/day, the combined
instrument settling and drift amounted to less than 0.7 microradian/day
and is nearly linear for the final 12 days. These data show that
unconsolidated sediment provides a satisfactory medium for submarine tilt
measurement of volcanic signals. Hard rock deployments during a cruise
on the East Pacific Rise exhibited similar drift rates.
Long Baseline Tiltmeter
Long-baseline tiltmeters (LBTs) are typically permanently emplaced
instruments that are prized for their high stability and accuracy, but
while LBTs have been used successfully on subaerial volcanoes, development
of a seafloor equivalent has proven quite difficult. Most LBT designs
and techniques used to install high-quality land instruments [Agnew 1986]
are impractical for submarine tiltmeters. For example, almost all
high-quality long-baseline instruments require a level installation, which
is essentially impossible to achieve without remotely-operated vehicles
or manned submersibles. However, center-pressure long-baseline tiltmeters,
in which the differential pressure in two fluid-filled tubes is measured
[e.g. Beavan and Bilham 1977; Agnew 1986], are feasible on the seafloor;
we have chosen such a design.
A detailed description of the design and operation of the long-baseline
instrument is given in Anderson et al. 1997; here, we give a brief
summary.
The tiltmeter, shown in Figure 4, is essentially
a center-pressure design folded so that the two tubes are side-by-side,
with the differential pressure sensor at one end and fluid reservoirs sealed
with compliant membranes at the other. This configuration has several
advantages for seafloor work. First, because the fluid reservoirs
(which are open to environmental pressure) are side-by-side, potentially
significant pressure gradients need neither be compensated for nor
measured.
Also, only one pressure sensor is required, which makes both assembly and
deployment of the tiltmeter simpler. Finally, by choosing fluids
whose products of density and thermal expansivity are nearly identical,
we can make our instrument temperature compensating to first order.
Measuring submarine volcanic tilt using this type of instrument is
complicated by high confining pressures and rugged seafloor topography.
For a typical Mid-Ocean Ridge deployment, hydrostatic pressure is 107-108
times larger than the tilt-driven signals we wish to record, and since
we wish the instrument to record tilt while deployed on sloping terrain,
we require a both a high dynamic range and low component creep. One
commercial pressure sensor which fulfills these requirements is a variable
reluctance gauge manufactured by Validyne Engineering, which we operate
in a pressure-compensated oil bath to further reduce stress-driven creep
of the sensor components.
Juan de Fuca Experiment
During July to September, 1994, we deployed both long and short baseline
tiltmeters on Axial Seamount, on the Juan de Fuca ridge off Washington
state, for a test of their relative performance on volcanic terrain.
In all, six TILT-OBS, four long-baseline instruments (LBT) and three
electromagnetic
instruments were deployed for 9 weeks (Figure
5). We reasoned that if the tiltmeters functioned well, our test
might actually begin to contribute to our understanding of some important
questions of the deformation behavior of MORs and possibly the intrusive
dynamics and geometry. If the ground did not show any motion, we
would be able to make an estimate of the upper limit of ground tilt, which
had not been established, so far. Correlation of any surface deformation
data (even no motion) with seismic data would allow us to speculate on
the existence of aseismic magma transport, and/or the correlation of release
of seismic energy and surface strain. The thin oceanic crust has
virtually no buffering capability for the nearly continuous magma delivery
from the mantle, in particular when compared to the thick crust at Iceland
and Hawaii which quite successfully modulates the magma delivery.
Tilt data or lack thereof, in particular in the context of well located
seismic swarms, could have important implications for the magma migration
from the mantle into the AMC.
During the week prior to our deployment in late June 1994, a significant
earthquake swarm associated with Axial Seamount was detected by the SOSUS
array. C. Fox of NOAA suggested that we relocate our experiment to
the seamount, which would provide us with the opportunity to monitor a
volcano either during further eruptions or in a post-crisis mode.
This location had the added advantage that Fox had two deformation instruments
currently recording at that site [Fox 1990b, Fox 1993b]. During the
deployment cruise, the RV Atlantis-II was diverted to the area to conduct
CTD measurements, following the events detected on the SOSUS array.
At that time (July 3 1994) an attenuation anomaly was measured at the site
of TILT-OBS Janice and Phred (Figure 5)
characteristic
of a bacteria bloom associated with recent volcanic activity (Embley, pers.
comm.). The seismic swarms did not continue following our deployment.
Five TILT-OBS recorded data for the entire time as did one LBT; the
faults which prevented the other three long-baseline instruments recording
were isolated and are preventable in future operations. A comprehensive
data set has been obtained, with 30 channels of short baseline tilt exhibiting
typical drift rates of less than 1 microradian/day, one channel of long
baseline tilt with a drift rate of 1-3 microradian/day, a temperature record
precise to a fraction of a millidegree, 9 channels of magnetic field, 6
channels of electric field, 15 channels of continuous seismic data and
5 hydrophone records. The magnetic and electric field data are discussed
in Heinson et al. 1996. Analysis of the seismic data is currently
underway and will be published separately [Tolstoy et al. 1997].
Short baseline tiltmeter results.
Comparison of the inclinometer on the equatorial ring (lowest gain),
the inclinometer on the seismometer platform (intermediate gain) and the
precision tiltmeter (highest gain) demonstrates that all channels provide
consistent records and are indeed measuring sensible tilt. This shows
that the initial drift is associated with platform settling rather than
with the sensor or its mounting, and therefore that sensor drift is not
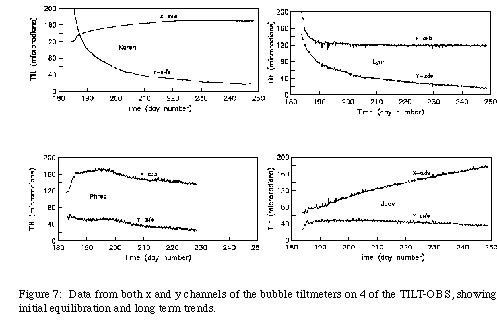
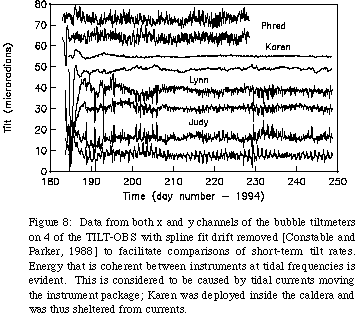
a serious problem (Figure 6). Figures
7 and 8 show tilt data (high gain sensor)
from 4 instruments. Figure 7 shows
the raw data which illustrate the initial equilibration and long term trend
of the instruments. Platform settling is the most significant signal for
at least the first month of the deployment, which suggests that long-term
ëdriftí rates will improve when the instrument is deployed for longer time
periods. Figure 8 shows the data with
a spline fit drift removed to enable the shorter term variations to be
compared. Note that there are periods of higher 'noise' (variations
at tidal frequencies), which are consistent from instrument to instrument,
further indicating that they are measuring a true signal. One instrument
(Janice, not shown) exhibited a dramatic increase in noise during the second
half of the deployment, associated with instrument stability and perhaps
indicating opening of an active venting system near the instrument.
This instrument was located where the attenuation anomaly was detected
by Embley et al.. Another instrument (Sharyn) operated for most of
the time but a SeaScan clock error has so far made it impossible to play
back the data. Tilt rates after initial equilibration vary from less
than 1/10 to more than 10 microradian/day (about 10-7 to 10-5m displacement
over the 1 m baseline of the OBS), perhaps associated with varying success
at establishing a stable resting place on the seafloor or perhaps in part
a measure of Axial Seamount inflation. The extreme sensitivity of
the short baseline sensor is demonstrated in Figure
9, where the x-axis data from Karen are filtered at tidal frequencies
and compared with a theoretical model of Earth tides. The general
agreement is good, and the amplitude enhancement of the tiltmeter tidal
record may be the result of the thin lithosphere and extreme heterogeneity
of the site. This result demonstrates that we have a resolution of
better than 0.1 microradian at periods of 12 hours to one day. While
it is difficult to prove that Earth tides are definitely the source of
the signal, our measurements do at least put an upper bound on Earth tides
at this location. The high frequency variations evident in Figure
8 are tidal in nature and probably due to tidal currents moving or
deforming the instruments; Karen, deployed in the relative shelter of the
caldera, was minimally affected by currents. The data from Karen
set an upper limit for inflation at 0.4 microradian/day at an azimuth of
160°. This is a significant first result for a seafloor study.
Even on the noisier instruments the resolution is such that it is clear
that no significant intrusive or extrusive activity occurred during our
deployment. While this type of deployment is, therefore, more than
adequate for monitoring such events, further significant improvements in
resolution could be made by preventing the instrument rocking. We
believe that securing the instruments to the seafloor, through cementing
the anchor feet or other means, would allow consistent resolution at least
as good as instrument Karen, which was sheltered from the currents.
Long baseline tiltmeter Data
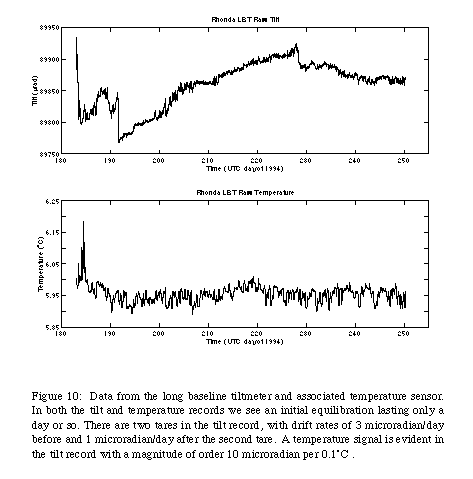
Figure 10 shows raw data from the
long-baseline
tiltmeter Rhonda. A detailed analysis of the long-baseline data is
given in Anderson et al. [1997]; here, we summarize their arguments.
After about 10 days of rapid instrument equilibration, a long-term signal
is evident with tilt rates about 5 microradian/day near day 190, decreasing
non-linearly to less than 1 microradian/day near day 240. Superimposed
on this slow drift, which is likely due to continued instrument settling,
there are two abrupt offsets at days 193 and 229, with amplitudes of 56
and 19 microradian, respectively. The offsets are likely due to settling
of the fluid reservoirs or sensor block; if so, the offsets could be explained
by about 5.6 and 1.9 mm relative height change over the 100-meter instrument
baseline. Additionally, there is an approximately tidal variation
visible, with amplitudes of about +/-6 microradian, much higher than the
0.2 microradian expected tidal tilt.
There are several possible explanations for the ìtidalî signal, with
the two most likely being temperature and ocean current forcing.
The data from a temperature sensor on Rhonda are shown in Figure
10. Anderson et al. [1996] use these data to reject temperature-driven
tilt as a major effect, because the apparent temperature coefficient of
the long-baseline tiltmeter is implausibly large and because spectral phase
relationships show that temperature lags tilt by 40 minutes, which makes
a simple causal relationship unlikely.
Ocean current forcing is the most likely explanation for the high-frequency
variations seen in Rhonda's tilt data. Physically, currents could
drive ìtiltî by vortex shedding or induced motion of either the fluid reservoir
assembly or tubing. Our electric field data record motionally-induced
electric fields [Filloux, 1987] , and thus may be used as proxies for ocean
currents in comparisons with tilt data. We note significant, though
weak, coherence between the electric field data from Pele and the tilt
from Rhonda, which suggests that ocean currents are partially, though not
completely, responsible for the high-frequency ìtiltî variations.
Long-term drift rates on both the long- and short-baseline tiltmeters
are in the range from about 1-10 microradian/day, with the rates decreasing
over time on both instruments. It is likely that both types of instruments
would, over the course of a few months, reach a low, stable long-term tilt
rate. A comparison of Figure 8 and
Figure 10 shows that the data from Rhonda
are only about a factor of two noisier than the data from Phred, Judy,
and Lynn (Karen was deployed in the shelter of the caldera, where current-forced
tilting is much lower).
Conclusions
We have developed two fundamentally different types of instruments
capable of measuring seafloor tilt. Tilt rates on all the instruments
are of the order of 1 microradian per day, and would have shown us all
major deflation events in the Uwekahuna record (Figure
1). Many of the inflation-events would have also been distinguishable
given the observed tilt rates on these instruments. Tilt rates commonly
accelerate before eruptions or major intrusive events, while rates for
our instruments decelerate during the initial equilibration. We should
clearly observe the sawtooth pattern of accelerated tilt, followed by sudden
deflation.
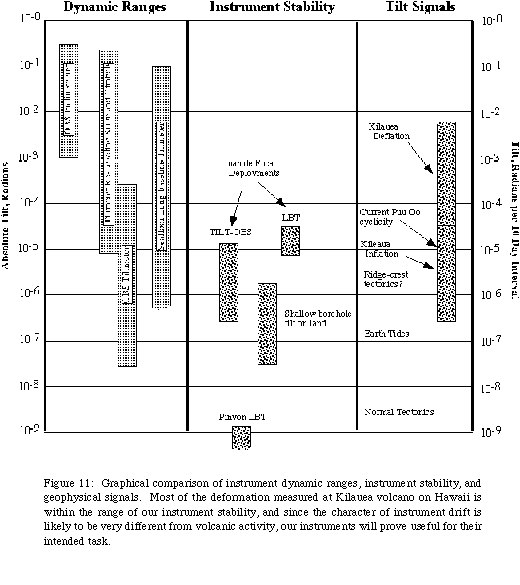
Figure 11 reviews our current level
of tiltmeter performance in graphical form. It demonstrates, again,
that most volcanic tilt signals would be within the capabilities of our
instruments. It also suggests that, given resources to continue our
program, improvements can be made. The stability of shallow borehole
tiltmeters on land is limited by actual ground motion associated with
temperature
cycles and precipitation, but neither of these factors is of great consideration
on the seafloor. The order of magnitude improvement we need to capture
the full spectrum of volcanic deformation faithfully is achievable, given
our progress so far. However, we would like to note that the long
baseline instrument at Pinyon Flat (operated by Wyatt), representing the
best of instrument performance, is one of only a handful of this quality
in the world and took about a decade to develop to this stability.
Among other things, it involves drilling boreholes at the ends for
anchoring.
It is probably safe to say that an instrument of this ilk could never be
operated on the seafloor, and while we might be able to achieve one, or
perhaps even two, orders of magnitude improvement in our seafloor instruments,
it is unrealistic to expect quality comparable to the Pinyon installation
from the seafloor.
The data from TILT-OBS Karen represents the most accurate seafloor
tilt measurements made to date. The resolution exhibited of 0.1
microradians
at periods of 12 hours to one day we believe to be attributable to the
relative shelter from currents of the caldera. In future deployments,
sheltering the instruments from currents, or preferably fixing the instruments
to the seafloor, should enable measurements of at least this accuracy to
be made using all the TILT-OBS instruments on a routine basis.
Acknowledgments:
We thank David Willoughby, Crispin Hollinshead, Paul Zimmer, Tom Deaton
and Jacques Lemire for engineering and technical support. We thank
the officers and crew of the RV Wecoma, Jeff Babcock, Stuart Johnson and
Barry Kirkendall for their help in collecting these data. We also
thank Chris Fox for suggesting the site relocation following an earthquake
swarm on Axial Seamount, and for his advice and insight in choice of individual
instrument sites. Finally we thank H. Fujimoto and an anonymous reviewer
for careful and thorough reviews which greatly improved the paper.
This work was supported by National Science Foundation grants OCE-8911428
and OCE-9200879.
References
Agnew, D.C., 1986, Strainmeters and Tiltmeters, Rev. Geophys., 24:579-624.
Anderson, G., S. Constable, and H. Staudigel, 1997, Development of
a Long-Baseline Seafloor Tiltmeter, in press J. Geophys. Res..
Baragar, W.R.A., M.B. Lambert, N. Baglow and I.L. Gibson, 1987, Sheeted
dykes of the Troodos ophiolite, Cyprus . In "Mafic Dyke Swarms", ed. H.C.
Halls and W.F. Fahrig, Geol. Assoc. Canada, 257-272.
Beavan, J. and R. Bilham, 1977, Thermally induced errors in fluid tube
tiltmeters, J. Geophys. Res., 82:5699-5704.
Cann, J. R., 1970, New model for the structure of the Ocean crust,
Nature, 226:928-930.
Constable, C.G. and R.L. Parker, 1988, Smoothing, splines and smoothing
splines; their application in geomagnetism, J. Comput. Phys., 78:493-508.
Decker, R.W., 1987, Dynamics of Hawaiian volcanoes: An overview. In
"Volcanism in Hawaii", ed. Decker, R.W. , Wright, T. L., and Stauffer,
P.H. , U.S. Geol. Surv. Prof. Pap. 1350, United States Government
Printing Office, Washington DC., 997-1018.
Duennebier, F.K. and D. Harris, 1990, Broad-Band Seismometers on the
Ocean Floor, EOS Transact. Amer. Geophys. Union, 70:1216.
Filloux, J.H., 1987, Instrumentation and experimental methods for oceanic
studies, in Geomagnetism , edited by J.A. Jacobs, Academic Press, London,
143-248.
Fox, C.G., 1990a, Results from three years of monitoring of ground
deformation at Axial Volcano, Juan de Fuca Ridge, using a bottom pressure
recorder, EOS Transact. Amer. Geophys. Union, 71:1609.
Fox, C.G., 1990b, Evidence of active ground deformation on the mid-ocean
ridge: Axial Seamount, Juan de Fuca Ridge, April-June 1988, J. Geophys.
Res., 95:12813-12822.
Fox, C.G., Dziak, R.P., Matsumoto, H., and Schreiner, A.E., 1993a,
Potential for monitoring low-level seismicity on the Juan de Fuca Ridge
using military hydrophone arrays, Marine Technology Society Journal, 27:22-30.
Fox, C.G., 1993b, 5 years of ground deformation monitoring on axial
seamount using bottom pressure recorder, Geophys. Res. Lett.,
20:1859-1862.
Fox, C.G., 1995, Special Collection on the June 1993 volcanic eruption
on the CoAxial segment, Juan de Fuca Ridge, Geophys. Res. Lett., 22:129-130.
Heinson, G., S. Constable, and A. White, 1996, Seafloor Magnetotelluric
Sounding Above Axial Seamount. Geophys. Res. Lett., 23:2275-2278.
Kidd, R.G.W., 1977, A model for the process of formation of the
upper oceanic crust, Geophys. J.R. Astron. Soc., 50:149-153.
Kidd, R.G.W. and Cann, J.R., 1974, Chilling statistics indicate
an ocean-floor spreading origin for the Troodos Complex, Cyprus, Earth
Planet. Sci. Letts., 24:151-155.
Langmuir, C. H., J. F. Bender, and R. Batiza, 1986, Petrological and
tectonic segmentation of the East Pacific Rise, 5° 30' - 14°30'
N, Nature, 322:422-429.
Okamura, A.T., J.J. Dvorak, R.Y. Koyanagi, and W.R. Tanigawa, 1988,
Surface Deformation during Dike Propagation, in E.W. Wolfe, ed., The Puu
Oo eruption of Kilauea volcano, Hawaii: episodes 1 through 20, January
3 1983, through June 8, 1984, U.S. Geological Survey Professional Paper
, 1463:165-181.
Rubin, A.M. and D.D. Pollard, 1987, Origins of blade-like dikes in
volcanic rift zones, In "Volcanism in Hawaii", ed. Decker, R.W. , Wright,
T. L., and Stauffer, P.H. , U.S. Geol. Surv. Prof. Pap. 1350, United
States Government Printing Office, Washington DC., 1449-1470.
Sakata, S. and S. Shimada, 1984, Development of the Ocean Bottom Tiltmeter,
Journal of the Geodetic Society of Japan, 30:50-58.
Shimamura, H. and T. Kanazawa, 1988, Ocean bottom tiltmeter with acoustic
data retrieval system implanted by a submersible, Marine Geophysical Researches,
9:237-254.
Sigurdsson, H., 1987, Dyke Injection in Iceland: A review. In "Mafic
Dyke Swarms", ed. H.C. Halls and W.F. Fahrig, Geol. Assoc. Canada, 55-64.
Sigurdsson, H., and S.R.J. Sparks, 1978, Lateral magma flow within
rifted Icelandic crust, Nature, 274:126-130.
Staudigel, H., Wyatt, F.K., and Orcutt, J.A., 1991, Ocean bottom tiltmeter
developed for submarine volcano monitoring, EOS transact. Amer. Geophys.
Union., 72:289-295.
Staudigel, H., J. Gee, L. Tauxe, and R.J. Varga, 1992, Shallow
intrusive directions of sheeted dikes in the Troodos ophiolite: Anisotropy
of magnetic susceptibility and structural data. Geology, 20:842-844.
Tolstoy, M., F. Vernon, J.A. Orcutt, 1997, Magmatic Activity on Axial
Seamount: A Combined Ocean Bottom Seismic and Tilt Experiment, EOS Transact.
Amer. Geophys. Union, Fall AGU Meeting.
Varga, R., H. Staudigel, J. Gee and L. Tauxe, 1991, Structural
evidence fro horizontal emplacement of sheeted dikes in the Troodos Ophiolite.
Contributed paper at AGU Fall meeting, San Francisco.
Willoughby, D.F., J.A. Orcutt, and D. Horwitt, 1993 A
Microprocessor-Based
Ocean-Bottom Seismometer, Bulletin of the Seismological Society of America,
83:190-217.
Wolfe, E.W. , M.O. Garcia, D.B. Jackson, R.Y. Koyanagi, C A. Neal and
A.T. Okamura, 1987, The Puu Oo eruption of Kilauea volcano, episodes
1 -20, January 3 , 1983 to June 8 , 1984, U.S. Geol. Surv. Prof. Pap.,
1350:471-508.
Wyatt, F., J. Orcutt, G. Sasagawa, H. Staudigel, and P. Zimmer, 1996,
Towards In situ Monitoring of Active Submarine volcanoes : A Progress Report,
Fifth Circum-Pacific Energy and Mineral Resources Conference Transactions,
Editors: Salisbury, G. P. and Salisbury, A. C., Gulf Publishing
Company, Houston, TX, 757-773.