a) Download the data and import them into EXCEL. The last column has annual values - but you might have to sum up the monthly precipitation values. Determine minimum, maximum, average and standard deviation of the annual precipitation data using the equivalent EXCEL functions (MIN, MAX,AVERAGE,STDEV). Note that precipitation is measured in hundreds of inch, i.e. 1000 = 10 inches.
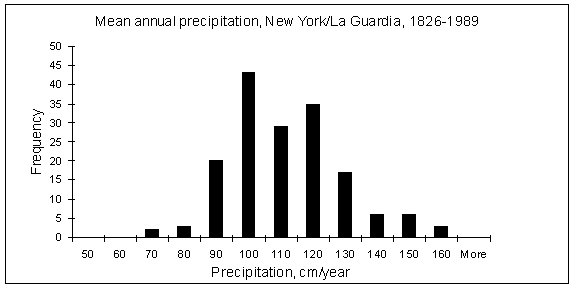
b) Make a histogram of the precipitation
data (see example below), print it out and hand it in.
c) Determine the amount of annual precipitation that is
exceeded every 20 years and that the precipitation falls
short of every 100 years.
Calculate the Reynolds number for the NYC water tunnels, assuming
an inner diameter of 24ft. There are two of these tunnels in
operation, determine the flow velocity from the amount of water
used in the city. The city uses ~ 1.1 billion gal/day.
Is the flow turbulent or laminar?
3.) (10
points) Potential
evaporation Measurement of changes in volume of water
in an evaporation
pan is a standard technique for estimating potential
evapotranspiration. United States Class A evaporation pans are
cylindrical with the following dimensions: depth = 10.0 inches,
and diameter = 47.5 inches. An evaporation pan can be considered
a hydrological system with an inflow, outflow, and storage
volume. Evaporation from pans is not the same as evaporation
from natural surfaces for a range of reasons. For example, water
temperatures in shallow pans will be much more variable than
temperatures in a nearby lake. Evaporation measured in pans is
adjusted by a factor called a pan coefficient to convert to an
estimate of potential evapotranspiration.
b) Calculate the flux of latent heat from the water in the pan to the atmosphere (W m-2).
