|
India Natural Disaster Profile
Basic Facts:
|
Area: 3,287,590
km2
Coastline:
7,000 km
Population:
1,065,070,607
|
GDP (PPP):
$3.033 trillion
GDP
Per Capita: $2,900
Population Below Poverty Line:
25%
|
Natural Disaster Risk Hotspots
Click on individual images for larger
view
 |
|
 |
|
 |
|
 |
|
 |
| |
|
|
|
|
|
|
|
|
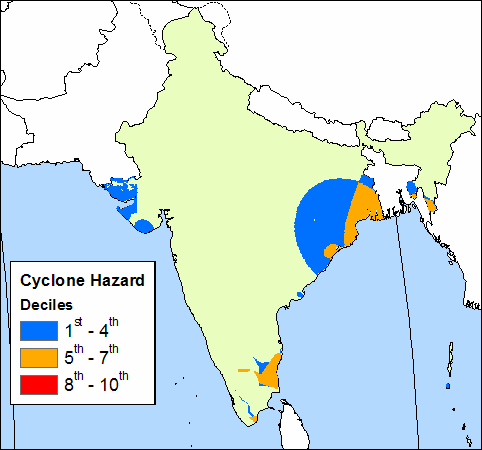
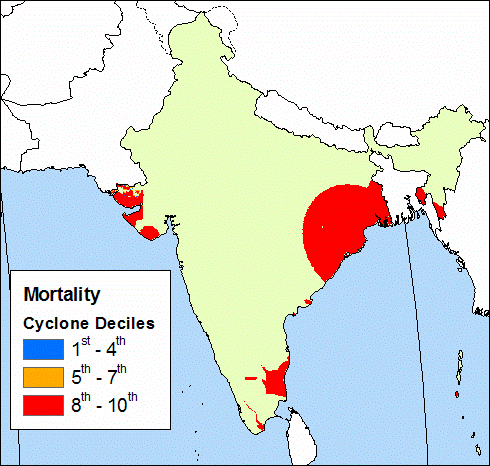
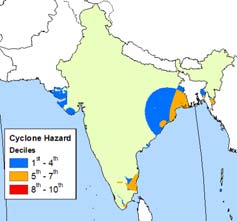
| Cyclones |
|
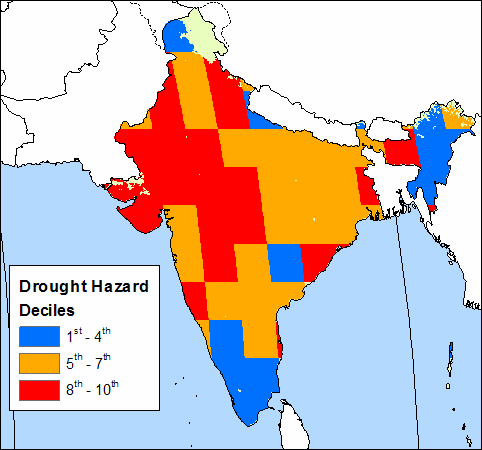
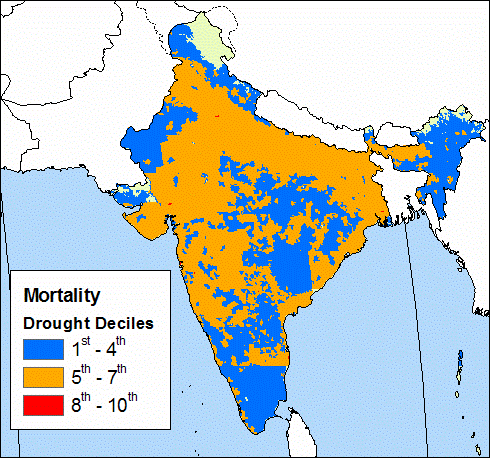
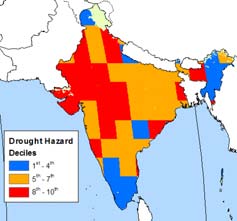
Droughts |
|
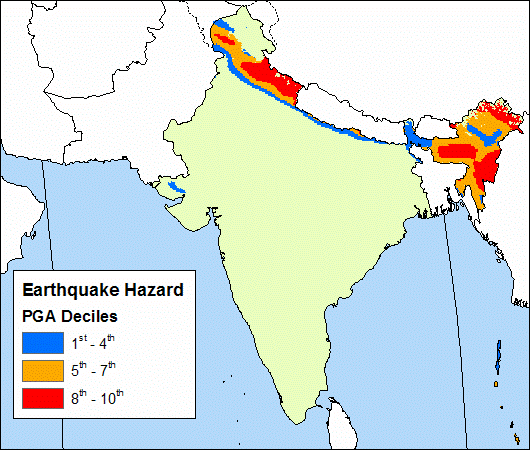
Earthquakes |
|
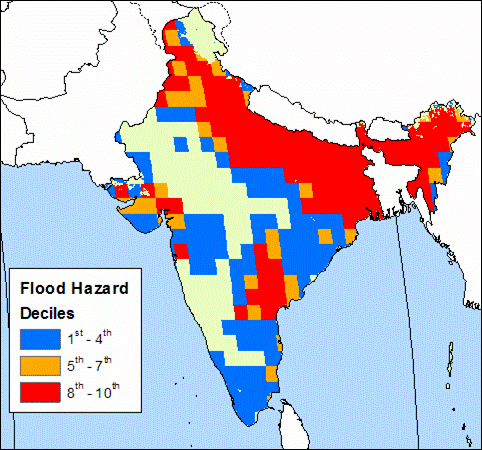
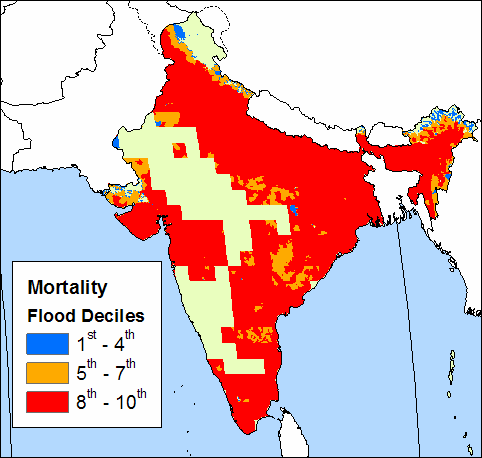
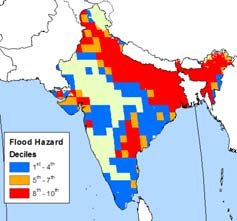
Floods |
|
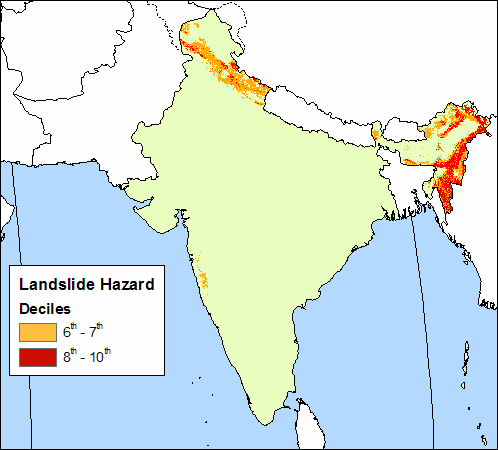
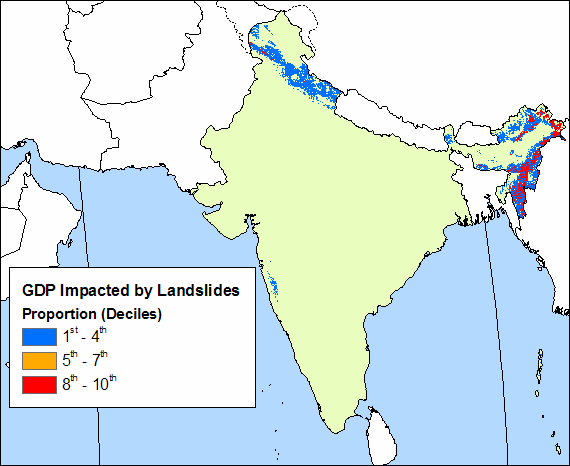
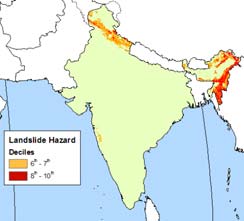
Landslides |
Natural Disaster Risk Hotspots (Weighted
by Mortality)
Click on individual images for larger
view
 |
|
 |
|
 |
|
 |
|
 |
| |
|
|
|
|
|
|
|
|
| Cyclones |
|
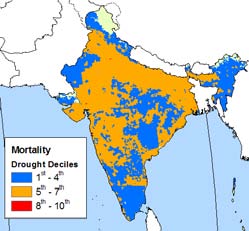
Droughts |
|
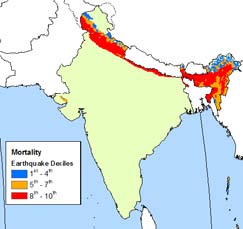
Earthquakes |
|
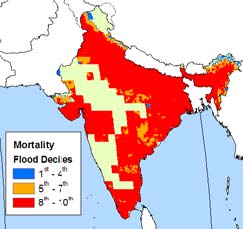
Floods |
|
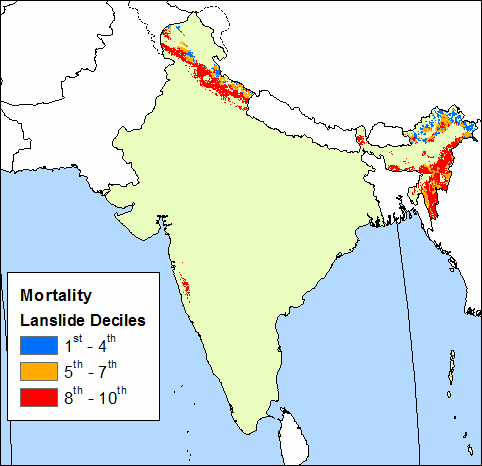
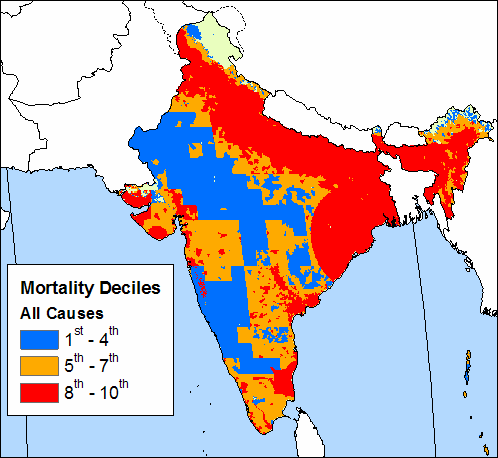
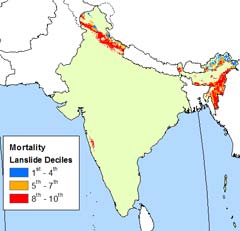
Landslides |
EM-DAT Information (1900 - 2004)
| Disaster |
# of Events |
Total Killed |
Avg. # Killed |
Total Affected |
Avg. # Affected |
| Cyclone |
133 |
162,986 |
1,226 |
91,322,407 |
686,635 |
| Drought |
21 |
4,250,430 |
202,401 |
1,391,841,000 |
66,278,143 |
| Earthquake |
24 |
60,396 |
2,517 |
27,108,561 |
1,129,523 |
| Flood |
158 |
51,020 |
323 |
663,187,348 |
4,197,388 |
| Volcano |
- |
- |
- |
- |
- |
Natural Disaster Risk Hotspots (Weighted
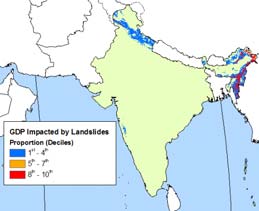
by Proportion of GDP Impacted)
Click on individual images for larger
view
 |
|
 |
|
 |
|
 |
|
 |
| |
|
|
|
|
|
|
|
|
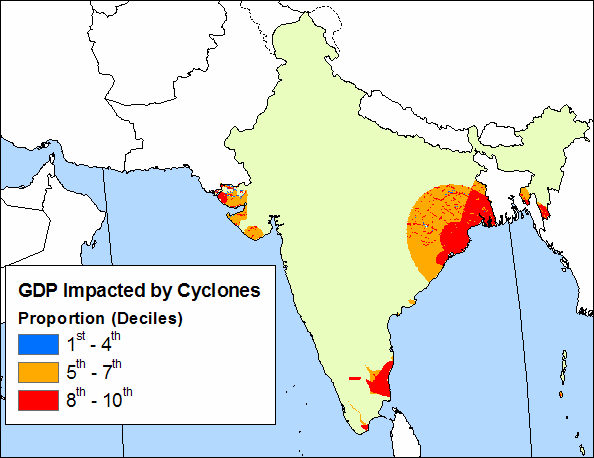
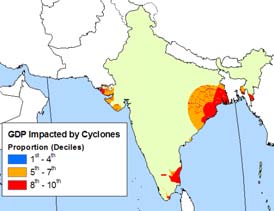
| Cyclones |
|
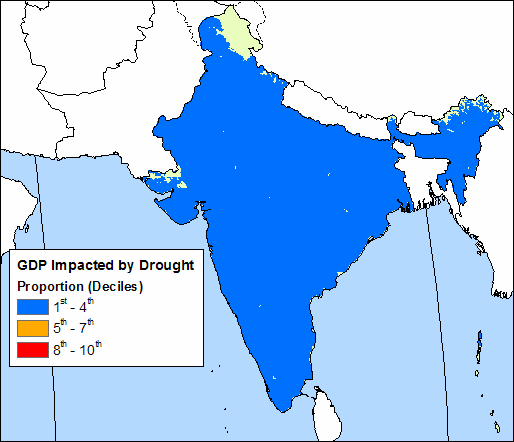
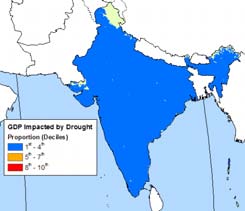
Droughts |
|
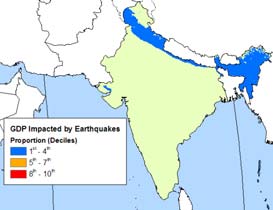
Earthquakes |
|
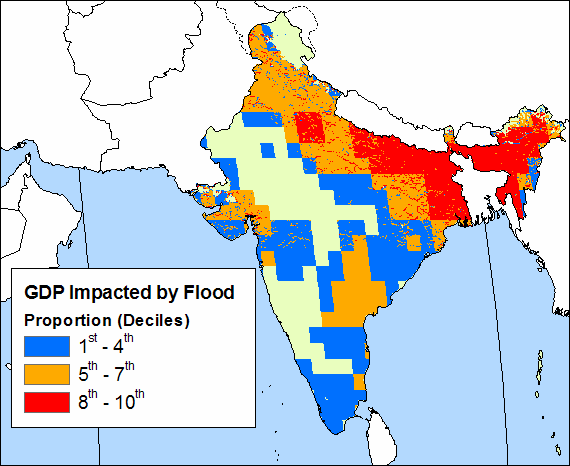
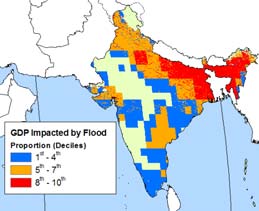
Floods |
|
Landslides |
Demographic Information:
Population within 1km
of coast |
Population within 2km
of coast |
Infant Mortality Rate
|
1,642,855 |
3,398,071 |
57.92 |
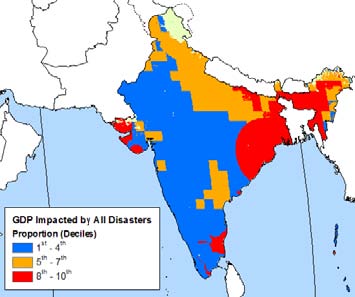
Multi-Hazard Disaster Risk Hotspots
(All Hazards combined and weighted by Mortality and Proportion
of GDP Impacted)
Click on individual images for larger
view
 |
|
 |
| |
|
|
| Mortality |
|
GDP |
Multi-Hazard Disaster Risk Hotspots
by Hazard Groups (Top Three Deciles)
Click on individual images for larger
view
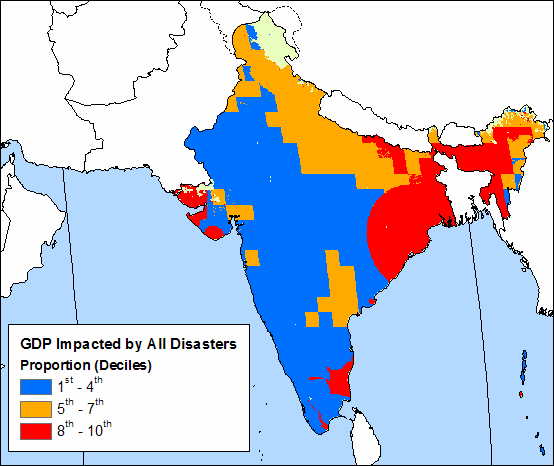
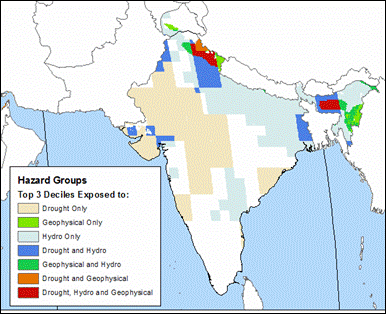
Observations
Floods and droughts significantly impact
the majority of India though they are most prevalent in the
northwestern and eastern regions respectively. Geophysical
hazards affect the Himalayan region in the north and northeastern
portions of the country where they rank in high deciles for
mortality and lower deciles for GDP impact. Cyclones influence
a relatively small area of the country but have high-ranking
mortality and GDP weighted impacts. Lastly, both the multi-hazard
mortality and GDP maps demonstrate that almost the entire
country is significantly impacted by at least one hazard and
mortality impacts are particularly concentrated in the north
and northeastern regions.
|