|
Sri Lanka Natural Disaster Profile
Basic Facts:
|
Area: 65,610 km2
Coastline:
1,340 km
Population:
19,905,165
|
GDP (PPP):
$73.7 billion
GDP
Per Capita: $ 3,700
Population Below Poverty Line:
22%
|
Natural Disaster Risk Hotspots
Click on individual images for larger
view
Natural Disaster Risk Hotspots (Weighted
by Mortality)
Click on individual images for larger
view
 |
|
 |
| |
|
|
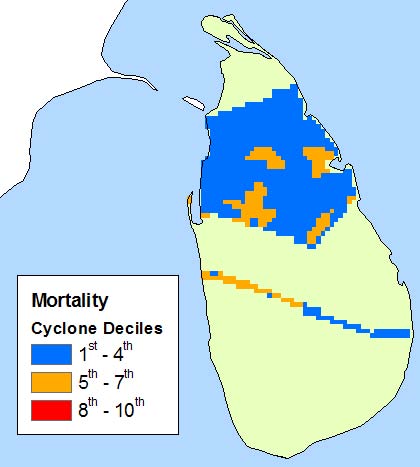
| Cyclones |
|
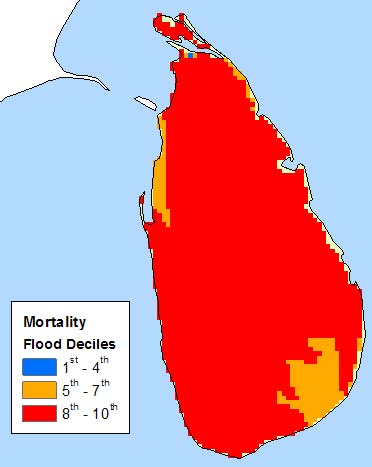
Floods |
EM-DAT Information (1961 - 2004)
| Disaster |
# of Events |
Total Killed |
Avg. # Killed |
Total Affected |
Avg. # Affected |
| Cyclone |
5 |
1,151 |
230 |
2,018,000 |
403,600 |
| Drought |
10 |
0 |
0 |
8,613,000 |
861,300 |
| Earthquake |
- |
- |
- |
- |
- |
| Flood |
36 |
937 |
26 |
8,957,728 |
248,826 |
| Volcano |
- |
- |
- |
- |
- |
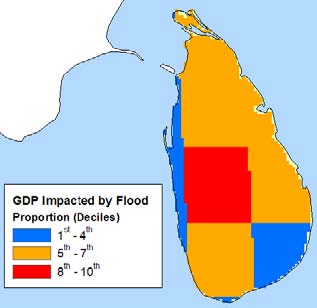
Natural Disaster Risk Hotspots (Weighted
by Proportion of GDP Impacted)
Click on individual images for larger
view
 |
| |
| Floods |
Demographic Information:
Population within 1km
of coast |
Population within 2km
of coast |
Infant Mortality Rate
|
550,208 |
889,676 |
14.78 |
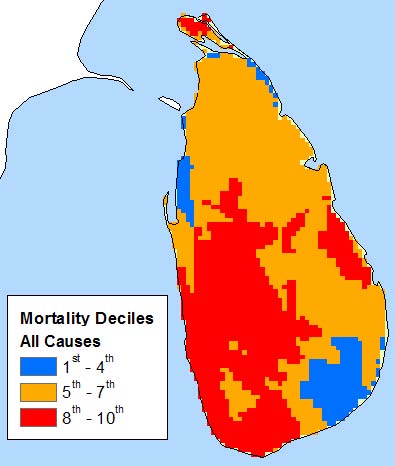
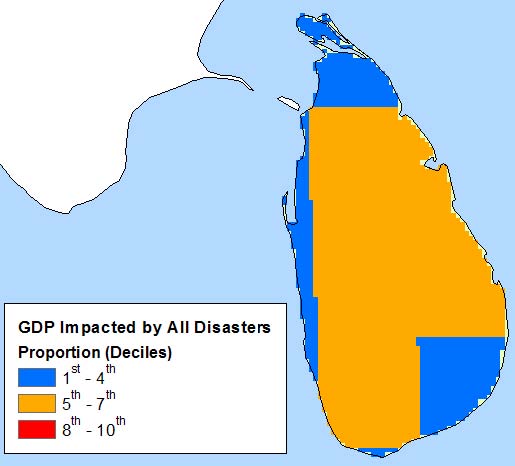
Multi-Hazard Disaster Risk Hotspots
(All Hazards combined and weighted by Mortality and Proportion
of GDP Impacted)
Click on individual images for larger
view
 |
|
 |
| |
|
|
| Mortality |
|
GDP |
Multi-Hazard Disaster Risk Hotspots
by Hazard Groups (Top Three Deciles)
Click on individual images for larger
view
Observations
Floods are the primary hazard affecting
Sri Lanka, ranking in high deciles when weighted by both mortality
and GDP. Cyclones affect the northern region of the country
but have a moderate to minor risk when weighted by mortality.
Compared with the rest of the world, the mortality weighted
multi-hazard map highlights that hazard pose significant risks
to the entire country and are especially severe in Sri Lanka’s
southwestern region.
|