|
Tanzania Natural Disaster Profile
Basic Facts:
|
Area: 945,087
km2
Coastline:
1,424 km
Population:
36,588,225
|
GDP (PPP):
$21.58 billion
GDP
Per Capita: $600
Population Below Poverty Line:
36%
|
Natural Disaster Risk Hotspots
Click on individual image for larger
view
| |
 |
|
 |
|
 |
| |
|
|
|
|
|
| |
Droughts |
|
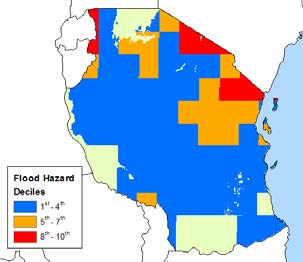
Floods |
|
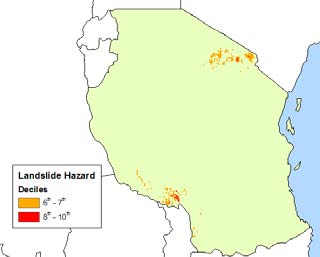
Landslides |
Natural Disaster Risk Hotspots (Weighted
by Mortality)
Click on individual image for larger
view
 |
|
 |
|
 |
| |
|
|
|
|
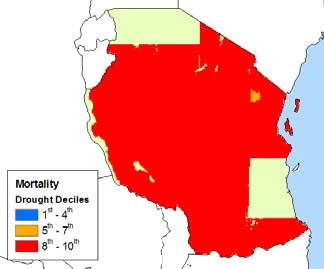
| Droughts |
|
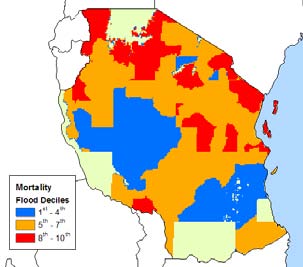
Floods |
|
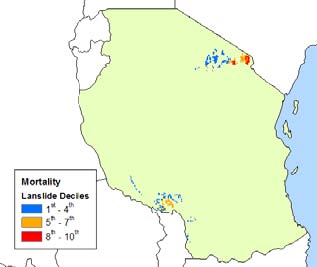
Landslides |
EM-DAT Information (1901 - 2004)
| Disaster |
# of Events |
Total Killed |
Avg. # Killed |
Total Affected |
Avg. # Affected |
| Cyclone |
1 |
4 |
4 |
2,500 |
2,500 |
| Drought |
12 |
0 |
0 |
12,863,483 |
1,071,957 |
| Earthquake |
8 |
7 |
1 |
3,991 |
499 |
| Flood |
24 |
531 |
22 |
843,046 |
35,127 |
| Volcano |
- |
- |
- |
- |
- |
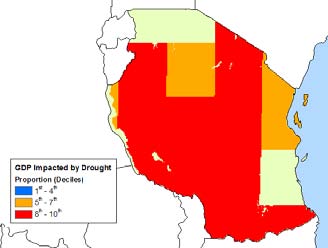
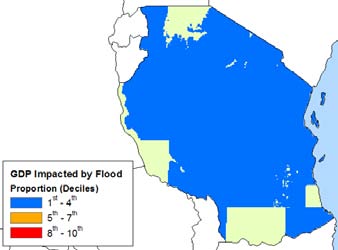
Natural Disaster Risk Hotspots (Weighted
by Proportion of GDP Impacted)
Click on individual image for larger
view
 |
|
 |
| |
|
|
| Droughts |
|
Floods |
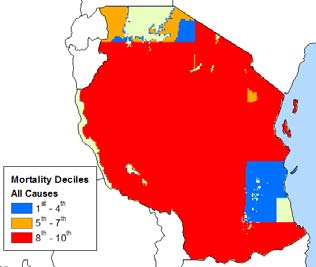
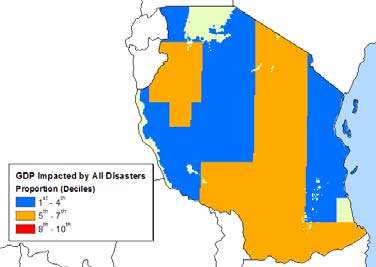
Multi-Hazard Disaster Risk Hotspots
(All Hazards combined and weighted by Mortality and Proportion
of GDP Impacted)
Click on individual image for larger
view
 |
|
 |
| |
|
|
| Mortality |
|
GDP |
Multi-Hazard Disaster Risk Hotspots
by Hazard Groups (Top Three Deciles)
Click on individual image for larger
view
Observations
Droughts and floods are the primary hazards
affecting the entire country. The maps exclude hazard impacts
in non-agricultural areas where small populations have been
masked out due to limited information. Droughts rank in the
top three deciles for all areas affected when weighted by
mortality and nearly all affected areas when weighted by GDP.
Floods represent a range of potential risk when weighted by
mortality and ranked in the lowest decile when evaluated based
on GDP impacted. Landslides pose a risk to a small region
in the in the north and south of the country. In the multi-hazard
maps, nearly the entire country is influenced by the two hydrologic
hazards.
|