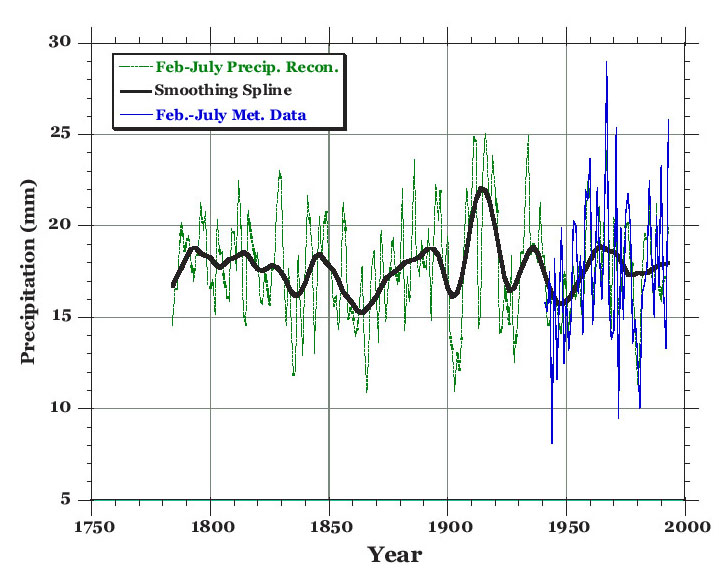
Figure 7: Manzshir Hiid Spring precipitation reconstruction
(February through July). The solid black line indicates a smoothed reconstruction.
The blue line represents the meteorological data.
The reconstruction is for February through
July and also uses current year and following year ring-width indices for estimating
the seasonalized precipitation. The model explains 36% of the precipitation variation.
TREE-RING LABORATORY, LAMONT-DOHERTY EARTH OBSERVATORY OF COLUMBIA UNIVERSITY. ROUTE 9W,
PALISADES, NEW YORK 10964
Voice: (845) 365-8517, Fax: (845) 365-8152