
 |
 |
 |
|
|---|
AGAP S
Project Overview
Project Overview
EXTERNAL LINKS
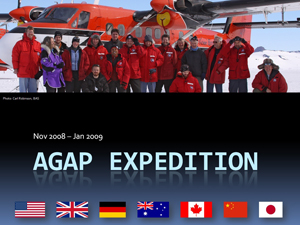 |
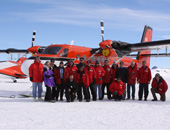
US Twin Otter (SJB) and team (photo Carl Robinson) |
FOR MORE IMAGES LINK TO PROJECT PHOTO ALBUM
The Project
The project involves several intersecting areas of research.
 The Mountains: Developing an understanding of the origin and the influences of the Subglacial Gamburtsev Mountains. The Gamburtsev Mountains positioned deep in East Antarctica, resting beneath the ice, lie below the highest, and perhaps the coldest, place on the East Antarctic Ice Sheet - ‘Dome A’. Discovered 50 years ago, in the International Geophysical Year, the very origin of these mountains remains a complete mystery. What caused them to ever be formed?
 Subglacial Lakes: Through the use of airborne radar and satellite measurements more than 200 subglacial lakes have been located in Antarctica. Beneath the ice sheet water moves between the lakes in a complex system of sub-ice rivers, streams and even swamps. Scientists believe water under the ice sheet greases the underside of the ice making the ice sheet slide faster. The moving water seems to have a direct link to ice sheet stability.
 |
| Photo Credit:Kendrick Taylor, DRI, University of Nevada-Reno. |
Climate: Much of what we know about climate change on our planet comes from ice cores. Ice cores are like climate libraries, capturing gases and atmospheric particles that provide information on the climate from earlier ice ages and warm periods. Many scientists hypothesize the oldest ice on the planet exists close to Dome A, so an ice core from this region will reveal the longest history of planetary change. Through our international collaborations, ice core samples will be recovered from this last great unknown region of Antarctica. Scientists hope that ice cores collected from Dome A will contain information that will shed new light on the origins of the Antarctic ice sheet and its role in future climate change. The image above shows an ice core assembly being put together.
The Tools

Airborne Geophysics & Seismic are the primary tools.
The AGAP S project involves several programs under one umbrella: The GAMBIT project which covers the airborne geophysics, and the GAMSIES program which covers the seismic. In 2007 the GAMSIES team was able to run a short field season to install an initial set of seismic stations to begin to capture data. This 2008/2009 field season will have both GAMBIT and GAMSIES teams operating out of AGAP S so that a full array of data is collected.
Click here for a full size image of the science being collected.
Why Airborne Geophysics?
 |
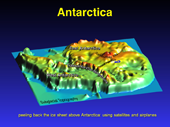
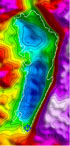
The central focus of this study is to gather information to accurately characterize the tectonic origin (construction or building) of the Gamburtsev Subglacial Mountains, the connection between these mountains and the covering ice sheet and subglacial lakes, and to identify the location of the oldest ice to enable the recovery of the oldest climate record. In order to study large regional geologic issues and questions, airborne geophysical surveys are often selected. Airborne radar and potential-field imaging are generally the most cost effective tools available for studying a large geographic region, such as the area defined as Dome A. The science research team will study an area larger than Texas. These geophysical tools are equivalent to running a medical scanning device over an ice covered continent. Just as doctors can learn about what is inside people using MRIs and Cat Scans, scientists use geophysical instruments to see what is under the ice sheet. Using airborne radar has added benefits in areas that are remote and difficult to access, however, working in an area as remote as Dome A presents multiple logistical challenges. |
| The satellite image of Antarctica shows the vastness of East Antarctica, which includes the large land mass on the right above. The tallest extent of the Gamburtsev Subglacial Mountains lies between E90° and E60° and along 80° latitude (the inner circle on the map above). Click to see how the state of Texas compares to the size of ANtarctica. |
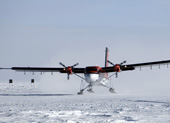
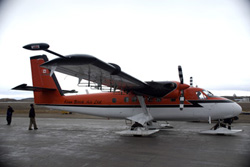 This project will use a fixed wing aircraft, a Twin Otter (pictured here) traditionally used in Alaska by bush pilots for data collection. The major new geophysical data set to be collected includes: gravity, magnetics, ice thickness, Synthetic Aperture Radar (SAR) images of the ice-bed interface, near surface and deep internal layers, and ice surface elevation. Once the plane is outfitted it will be like taking a laboratory into the air. So what will these different types of data tell us about the survey area?
 Radar - Recently developed and refined radar sensors can collect a comprehensive image of the ice and the interface between the ice and the underlying crustal surface. This radar technology can image the ice bed over an area spanning one kilometer on each side of the plane, as well as measuring ice thickness and mapping internal ice layers along the aircraft path. The ability to measure ice thickness AND imaging the ice bed simultaneously, is a relatively newly developed radar feature. The new techniques will be helpful for figuring out how wet the bottom of the ice sheet is and where the water might flow.
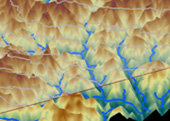
Radar data shown here was collected in Greenland as part of the test flight for this project. The vertical axis shows us depth of penetration of the radar, the horizontal axis shows the length of the track. Under the ice, the bottom, or bed image, is visible as the red undulating feature between 1.5 and 2.5 km under the ice. Internal layers are visible within the ice as wave like lines. These layers can represent annual accumulation of snow, or events may be captured in these layers. Click here to view a larger panel of this data.
Additionally, an ultra-wideband radar will be used to map differences in accumulation in the uppermost layers of the ice sheet, or what is referred to as shallow accumulation layers. This radar uses frequencies close to some microwave ovens. Data can be collected effectively on different zones of the ice sheet - dry, percolation and wet.
This means the radar data we collect on this project will provide us with new abilities to see details from inside the closest surface levels of the ice sheet, as well as deep into, and through the ice sheet. Ice is transparent to radar but not bedrock. Radar energy bounces very strongly off the mountains and valleys beneath ice sheet so the boundary between ice and bedrock is usually easily identifiable. This will let us determine ice thickness, internal ice movement, and assist in characterizing the surfaces below. The radar energy will bounce very very strongly off flat bodies of water underneath ice sheet so radar data will also be used to help locate subglacial lakes. By mapping the shorelines of the subglacial water bodies the radar can use used to determine how big the lakes are.
 Magnetics - A magnetometer is used to collect magnetic properties of the rocks under the ice sheet. Rocks in the Earth’s crust have a magnetic signature which relates to their composition, structure and when they were deposited. By collecting magnetic information on the underlying rocks we can attempt and determine what type of rock makes up the crust, how old the rock (or continental crust) is, and how this area matches together with other continental crust in other parts of the Earth. For example, volcanic rocks generally contain a much larger amount of iron than other rocks, such as sedimentary rocks, so the magnetic signal of a volcanic rock will be much higher than the magnetic signature of a limestone. The magnetic data from the Gamburtsev Mountains will give us information on how they were formed. If the mountains were formed through volcanism they will have more iron and a much higher magnetic signal than if they were formed through continental collision or rifting.
 Gravity - Although we usually think of gravity as being a constant (9.81 m/s2) the gravity changes all over the planet. Where there is more mass there will be a stronger gravity field. In the oceans scientists have used the concept that the gravity field is stronger over submarine volcanoes to map entire regions of the ocean where no ship has ever been. In Antarctica gravity data is used to map and interpret features hidden by the ice sheet especially features that relate to landslides, volcanoes, faults, water, and even tectonic events. New gravity meter technology used in this project will allow improved detection of sub-ice geologic features, even allowing the team to estimate how much water is in the subglacial lakes. The radar cannot see through much lake water so gravity is the only way to do this from an airplane. Gravity data collected will help us to calculate the density of the Earth’s crust, telling us what type of rocks are present, and can tell us how deep the subglacial lakes are. These pieces of information will allow us to ‘peel away’ the icy layers of this remote section of the continent, and create more accurate maps of the area.
 Lasar - A lasar altimeter fixed to the aircraft will constantly scan the surface of the ice during flights collecting information on topography or surface elevation. The instrument emits infrared laser pulses and measures their echoes as they return from the Earth to determine the shape and elevation of land surfaces. This information is important in understanding potential changes in the balance of the ice sheets. The mass balance of an ice sheet is a measure of gain or loss of snow and ice similar to the balance in a checkbook. A loss in the overall mass of ice and snow has been seen as an indicator of climate change. Loss in mass in a continental ice sheet would mean the ice sheet is shrinking, thus contributing some of its mass to the global oceans...this 'contribution' would add to sea level rise.
