 |
 |
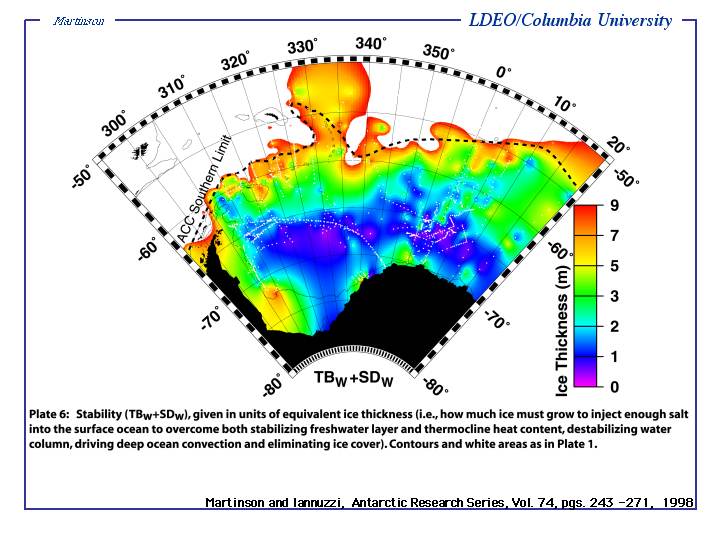
Plate 6 -The Bulk stability, Σ , is shown in Plate 6 |
 |
 |
Plate 7 -Plate 7 shows that fraction of bulk stability that is attributable to TBw,
γTB = TBw/ Σ. This clearly reveals that bulk stability throughout most of the area is due to
TBw, that is, to the deep ocean heat, not the surface freshwater layer |
 |
 |
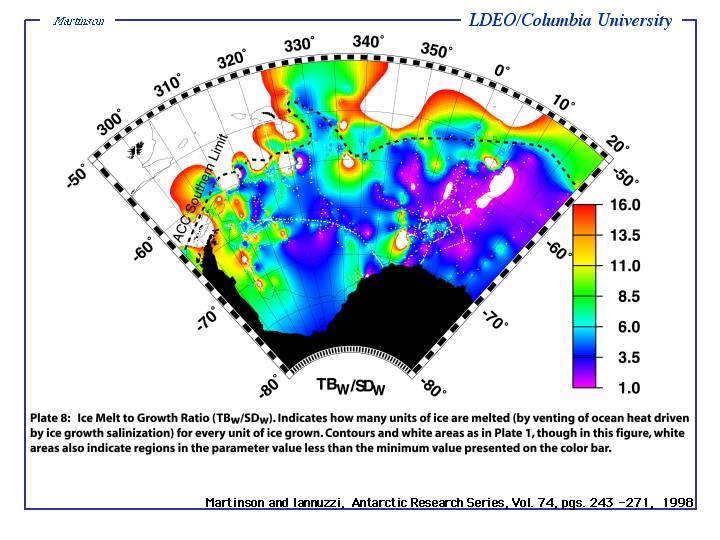
Plate 8 -The effectiveness of TBw in maintaining bulk stability is given by the ice melt
to growth ratio, γΘ = TBw/SDw in Plate 8. |
 |
 |
Plate 9 -Plate 9 shows the winter-average eddy diffusive heat flux, F DT, and its ice
thickness equivalent, ΘDT |
 |
 |
Plate 10 -Plate 10 shows the estimated entrainment heat flux, FET, and its ice thickness
equivalent, ΘET assuming an average 35 W/m-2 heat loss over the gyre. |
 |
 |
Plate 11 -Plate 11 shows that despite strong spatial gradients in the entrainment and diffusive heat
fluxes, realizing an order of magnitude difference in the diffusive flux for example, and reflecting gyre-scale processes such as upwelling, the total heat
flux, FT = FDT + FET , shows a remarkably uniform value (± 30% change)... |
 |
 |
Plate 12 -Plate 12 shows the spatial patterns of the ratio between the entrainment and diffusive
heat fluxes, γT = ΘET/ ΘDT |
 |
 |
Plate 13 -This plate shows the summer salt deficit, SDS, which varies from 0.2 - 1 m of
ice. |
 |
 |
Plate 14 -Plate 14 shows the size of the perturbation in annual ice thickness required to destabilize
the water column,... |
 |
 |
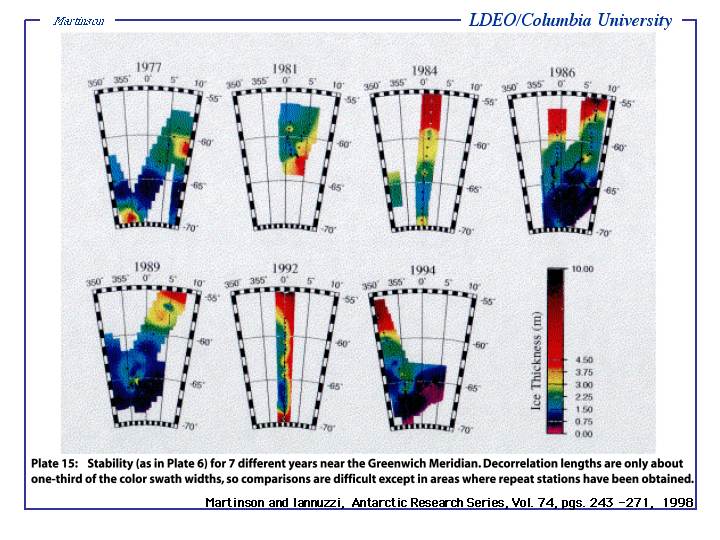
Plate 15 -...the area around Maud Rise has been sampled a number of different times over the last
couple of decades, but the actual overlap of stations within the local decorrelation lengths is quite small. Plate 15 shows bulk stability, Σ ,
for several different years in this locale: 1977, 1981, 1984, 1986, 1989, 1992, and 1994. |