A Case Study of 4D Analysis on a Deepwater Turbidite Sequence
Below is the complete sequence of the volumetric analyses of
drainage over time for two reservoir packages from a deepwater turbidite
sequence in the Offshore Louisiana Gulf of Mexico.
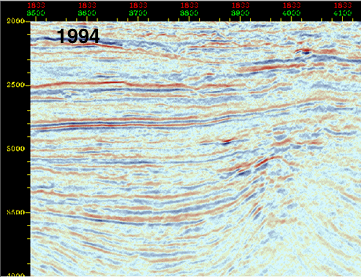
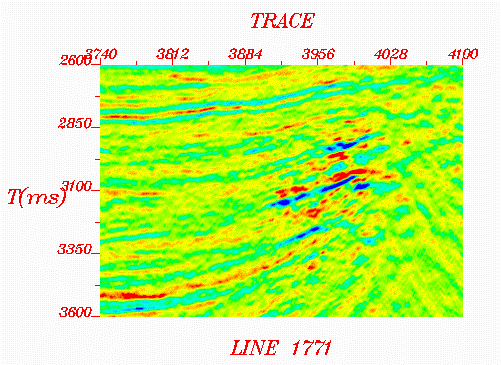
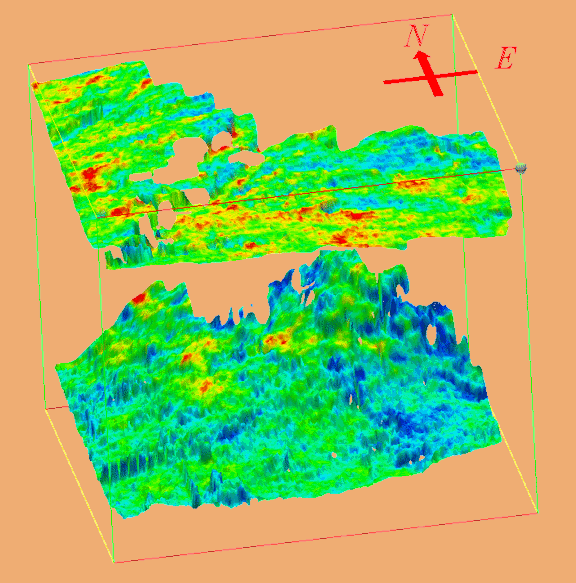
E-W Seismic reflection profiles across the main pay intervals of a
turbidite reservoir sequence, offshore Louisiana.
Horizon picking is on 1994 data
Figure 1
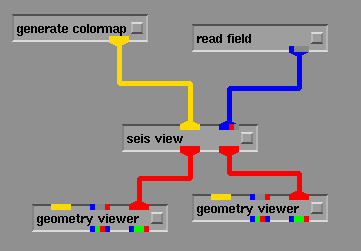
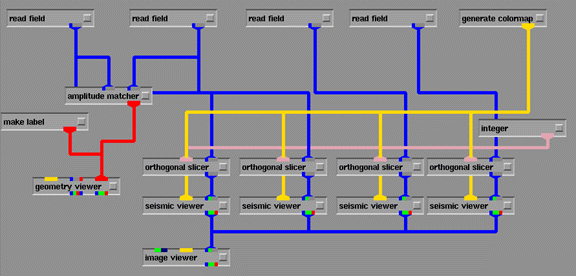
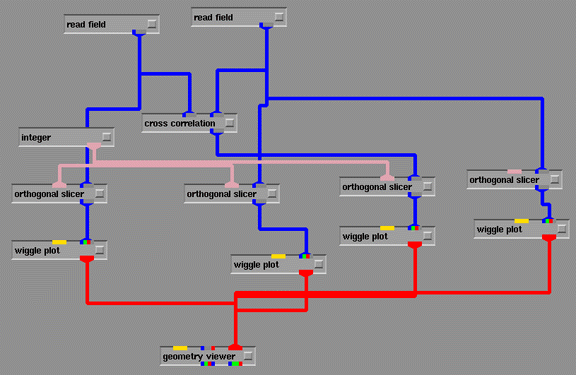
First, the Lamont 4D Software is used to load the 3D datasets into the AVS
Platform, and view the data to make certain it is loaded correctly. Here
is the network used to view each 3D dataset.
Figure 2
This is one of windows of seis view network
Figure 3
This is another window of the seis view network
Seis view lets you view 3D seismic in a user friendly way. One can
view seismic sections in line cross line, time slice, arbitrary slice.
The mouse can be used to pick arbitrary slices, even doing loops on
the survey grid, and the seismic section window will be updated
correspondingly. You can load well path and project them to the
survey grid. Also horizons can be easily mapped to the survey grid.
Figure 4
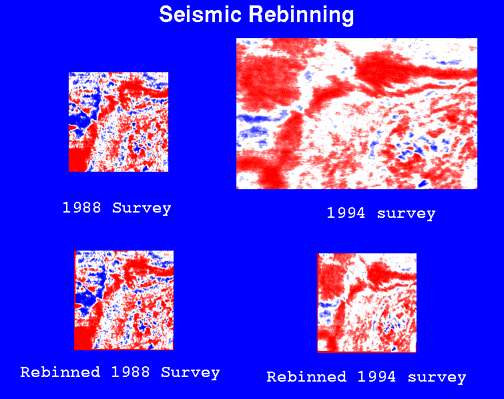
The next step is to rebin the datasets into the same orientation
and bin spacing. Here is the network configuration.
Figure 4B
We have rebined the 1994 3D seismic survey with 41' bin spacing
into the grid of the 1988 3D survey with 100' spacing.
Figure 5,
Figure 5B
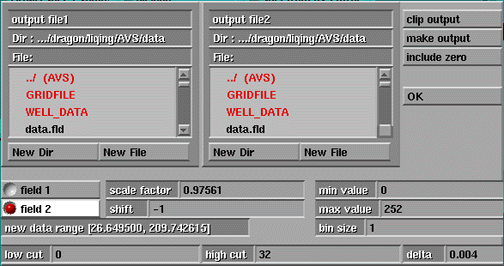
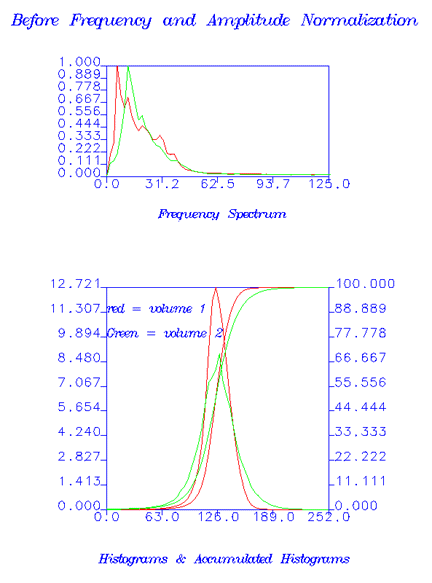
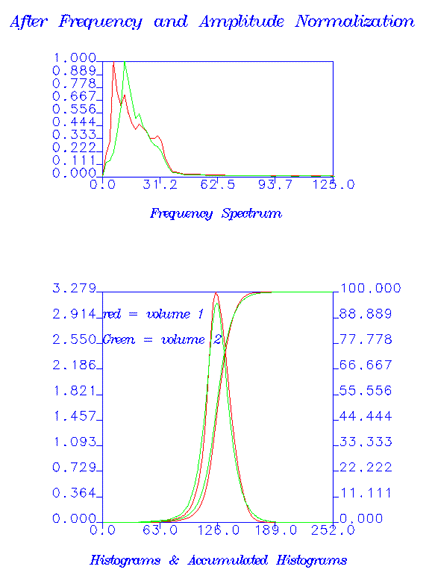
The two surveys were then normalized in frequency and amplitude.
Here is the network for the "amplitude matcher.
Figure 6
The histograms and frequency spectrums before normalization.
Figure 7
The spectrums and histograms after normalization.
Figure 7B
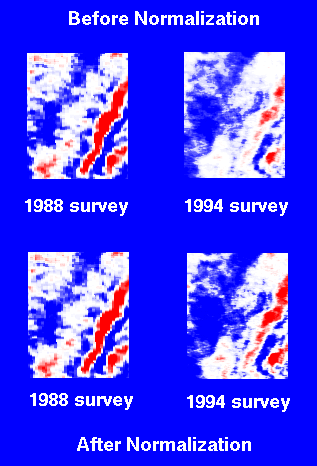
Seismic slices comparison after normalization and before normalization.
Figure 8,
Figure 8B
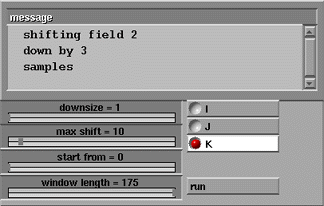
We then must assure that navigation and depths are correct, so we
have constructed a cross-correlation module that scans the two datasets and
recommends the movement or shifting of the old dataset to give best overall
correlation coefficient to the new dataset. Here, the old survey must be
shifted downward by 3 x 4 milliseconds of two-way travel time
Figure 10
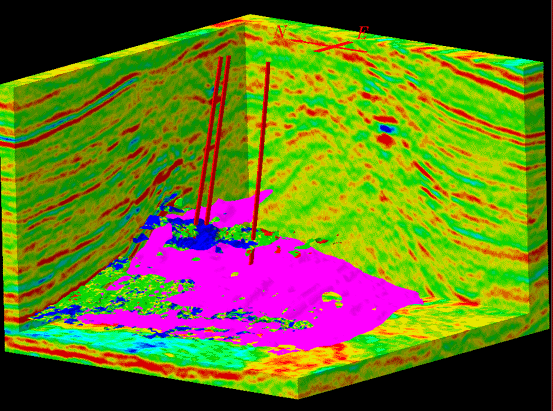
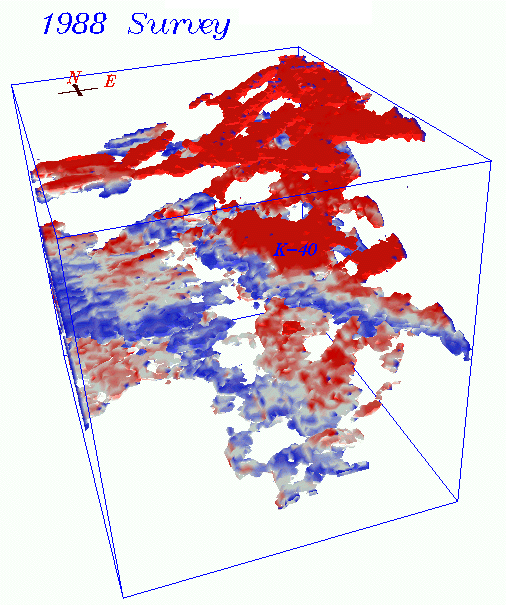
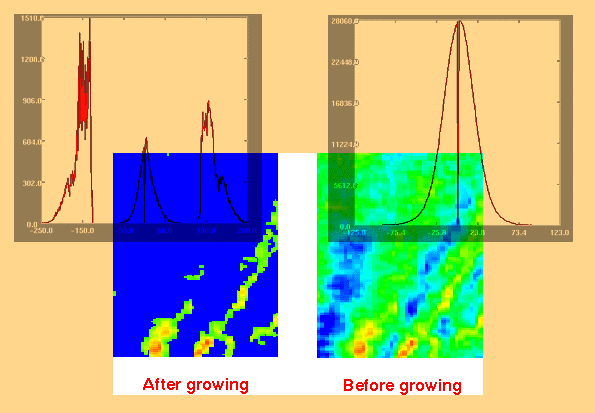
An important innovation in the Lamont 4D Software methodology is
to the "Region Grow" about the high amplitude volumes, or in this case, low
impedance "Seed Points" within the overall volume. The resulting
intelligent downsizing of the multiple 3D datasets leaves only the
interesting, high amplitude or low impedance regions remaining within the
volumes. Here is the volumetric representation of two pay reservoirs--the
K-8 at the top, and the K-40 (labeled) from the 1988 3D seismic survey.
Red is low impedance, blue and white are high, and you can see clearly the
oil/water contact in the K-40 from the blue/red boundary. Note the
tubulary character of the K-8.
Figure 11
Same region grown "manifolds" around regions in the 1992
survey. Note the thinned manifolds in the K-8 and the shrunken K-40.
Figure 12
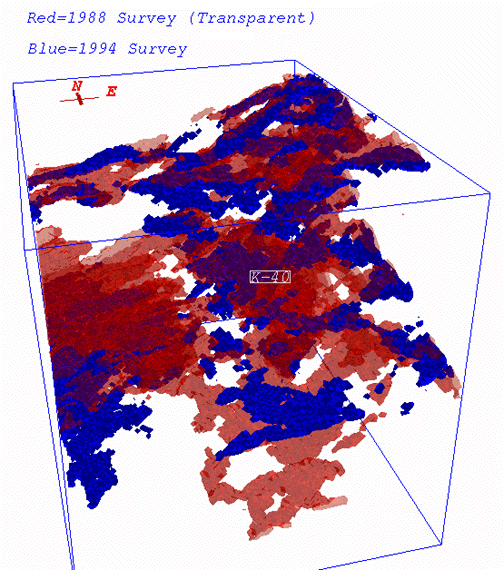
The region grown 1988 and 1994 surveys, colors represent real data values.
The region grown 1988 and 1994 surveys are plotted together in prespective view.
1988 survey is in red color, and 1994 is in blue color. Also, 1988 survey is transparent.
If you see that the blue color is changed, this indicates blue is
inside of the red surface.
Region Growing Study using K-40
We difference the volumes in two ways:
Region differences. The voxels not grown into by the region grower are
set to null values, so that a straight differencing of the two volumes
emphasizes where a region has shrunk or grown to, since values of amplitude
or impedance in locations outside the two regions have been replaced with
null values. This expands the histogram of amplitudes or impedances within
the volume into three populations:
those voxels with high and sustained amplitudes or low and sustained
impedances. We select green color for these voxels to imply bypassed
amplitudes or impedances.
those within a region at time 1, but outside the region at time 2.
These are areas of shrinkage, and we color them blue to denote dimming of
amplitudes or increase of impedances.
those within a region at time 2, but not at time 1. These are areas of
growth in the regions, and we color them red to denote brightening of
amplitudes or decrease in impedances.
The 3 peaks are used to set our red, green, blue colors for
Region Union. Now that we have quantitatively selected the colors for
dimmed versus sustained brightness or impedances, we can now construct the
actual amplitude (in decibels) or impedance (in gm-ft/cm3sec) changes that
have occurred in all voxels inside either the 1988 or 1992 regions. That
involves returning the actual observed value to those voxels that have been
nulled in one but not both surveys. Here is the result in the K-40 and K-8
reservoirs. They look different because the K-40 has a strong water drive,
whereas the K-8 is a depletion drive.
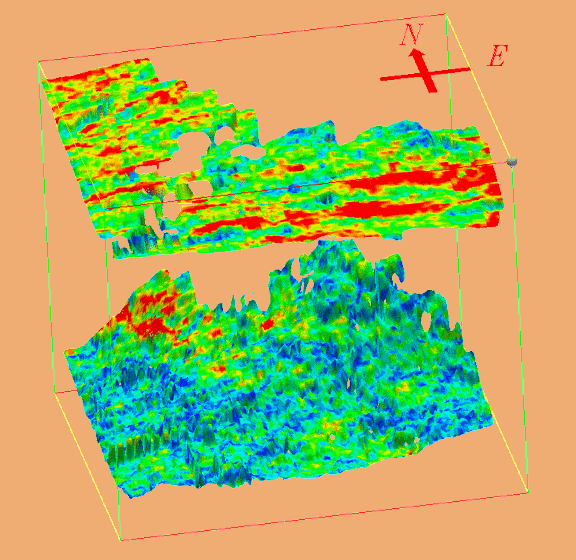
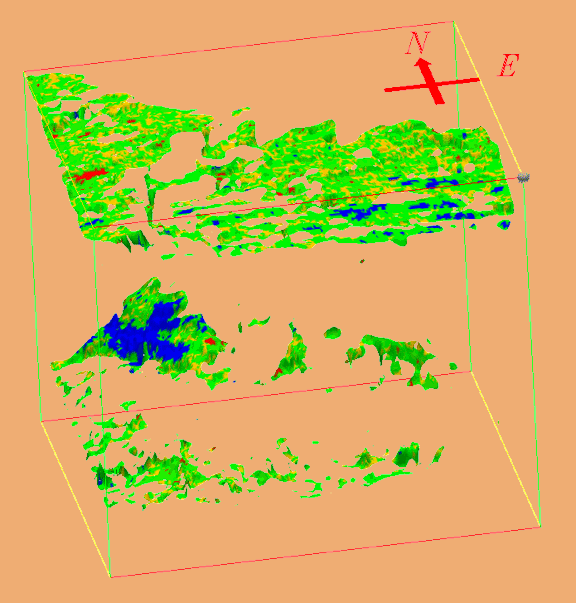
S2 Refl Strength
Displayed are volumetric representations of the K-40 reservoir and a marker
bed, the P-3 which is considerably upsection and a non-producing but
booming reflector in the 1994 seismic survey. In this case, it is a
lowstand shale.
S1 Refl Strength
Shows the 1988 data with its strong striping from acquisition in the P-3,
but not in the K-40.
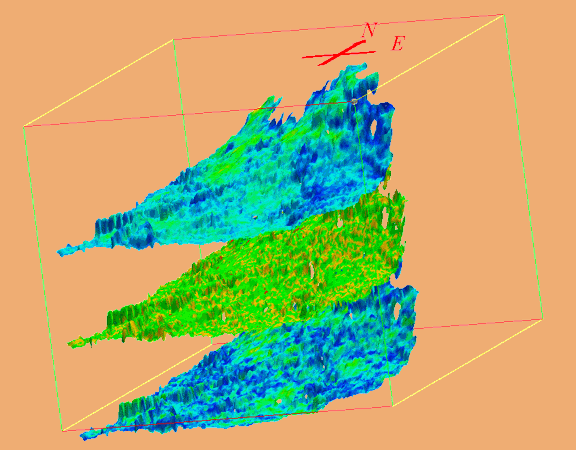
K-40/P-3, After Normalization
A good test for the success of normalization is to then go downdip to the
reservoir in the K-40 reflector and see if the normalization has produced a
water-wet interval with no change in amplitude or impedance between 1988
and 1994. Indeed, in the downdip portion of the K-40, grey in the center
differenced image is <10% change, and the speckles of white are <5%
difference between 1988 (above) and 1994 (below).
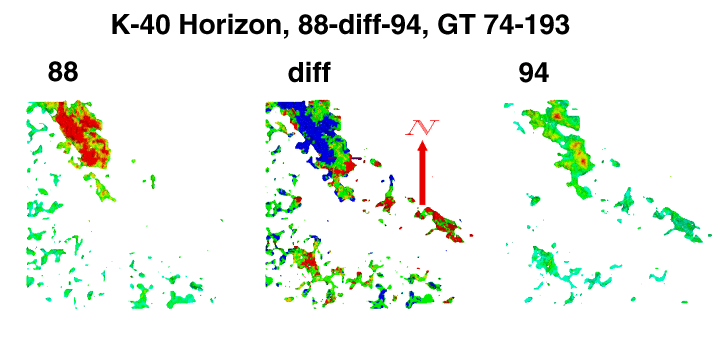
Zap of K-40 Horizon
Here is a "zap" of the K-40 main trough, compared with the 1988 and 1994
surveys.
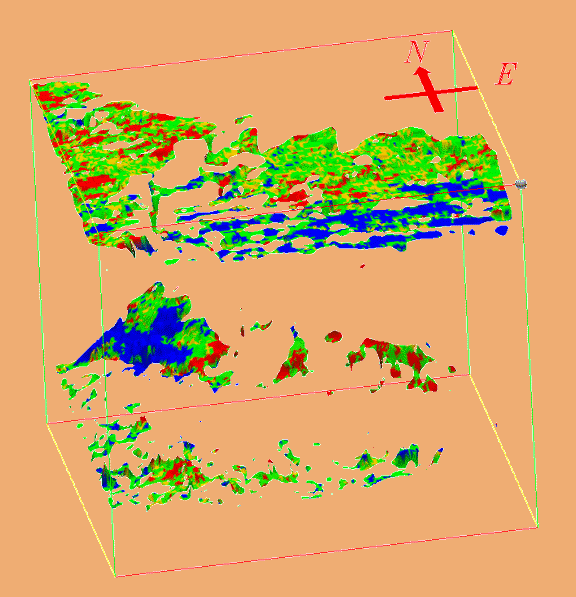
K-40, Region Difference
The difference emphasizes the striping because null values have replaced
amplitude values in voxels with just one grown region.
K-40, Region Union
The Region Union returns amplitude values to those voxels, giving a better
representation of the true differences between the volumes. Note the striping
has been well compensated for by the normalization. Water encroachment can
be seen from the volumetric differences between 1988 and 1992 regions of
the K-40.
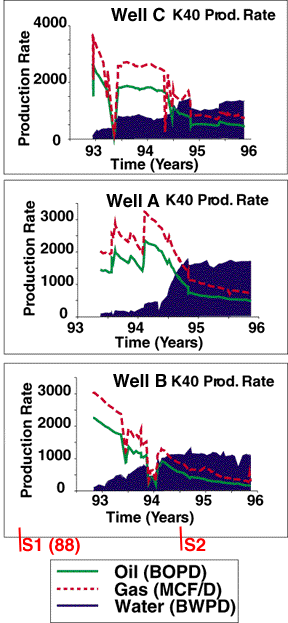
K-40 Production
This water movement is generally in agreement with the production histories
of the three wells into the reservoir in which water production began in
1993 in two of the wells and in 1994 in the updip well.
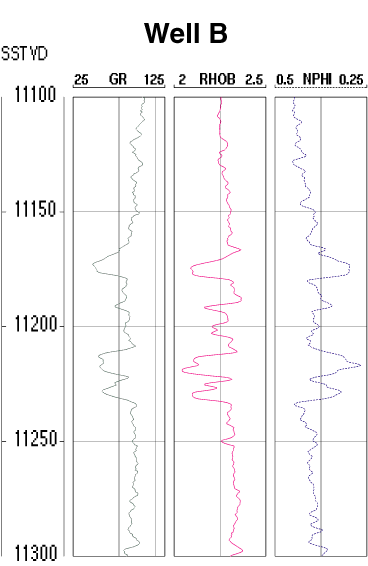
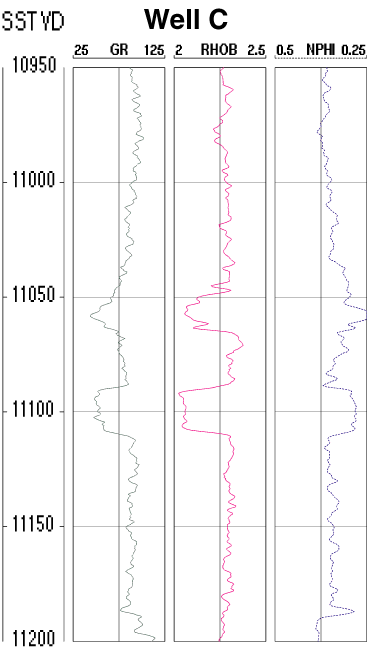
Well A Logs,Well B Logs,Well C Logs
Here are the well logs for the 3 producing wells into the K-40. Penn State
has conducted 1D synthetic seismic modeling that suggests that dimout of
either of these lobes should be expected with water encroachment, and that
the top lobe produces most of the seismic reflection strength across the
reservoir.
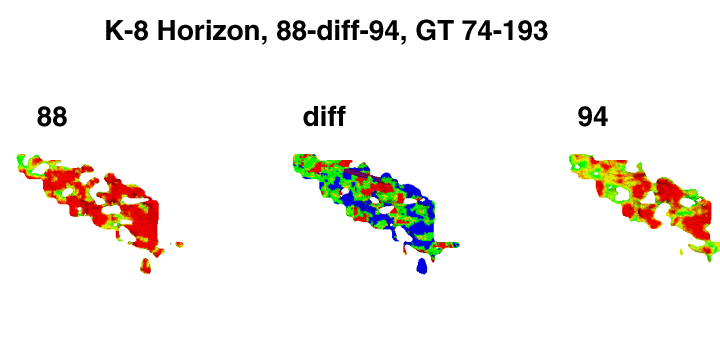
K8 Study
Zap of K-8 Horizon
The K-8/K-16 reservoir sequence is difficult to separate on either the 1988
or 1994 seismic surveys. The zap of the major K-8 trough shows "blotchy"
amplitude packets, rather than the clear oil/water contact movement present
in the K-40 sand. The reason is that this sand is a depletion drive
reservoir.
Region Growing Identifies Shrinkage
in K-8
Consequently, the region grower has "manifolded" the combination of the K-8
and K-16 sands. The region grown around this K-8/16 sequence is much more
"tubular" or "stringy" than in the K-40 sand. Compare the sand in 1988
(top) with its similar but somewhat depleted state in 1994 (center).
Oil/Water/Gas Regions in K-8
The union differences between the two surveys shows "stringers" of dimming
(water depletion ?) and brightening (gas coming out of solution) in the
bottom image. From the 4D analysis, we find the brightening more prominent
in the south but encroaching on the northern producing well.
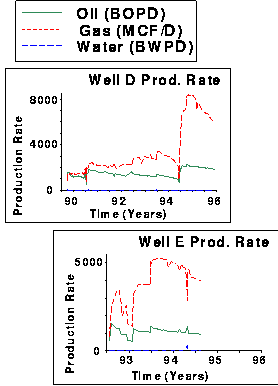
K-8 Production
The production histories of the two producing wells from the K-8 show gas
hitting the well about a year after the 1994 survey was acquired in the
northern well, but gas already having hit in the southern well by
1994.
The region grower presents us with a volumetric representation of the K-40
reservoir, within which no interpretation is required to examine the
fine-scale acoustic responses to the two lobes of the reservoir. The water
front encroaching in the K-40 can be seen clearly in an animation of slices
through the major trough in the impedance cube -- these slices are parallel
to the K-40 Zapped horizon pick. However, the sand contains two producing
lobes, at 50' thick top and a 25' thick bottom. We add the updip well log
that shows the location of the two lobes. In the top slice, which is at
the horizon picking location at the top of the sand, the updip portion of
the reservoir contains sustained low impedances, suggesting that the top
lobe still contains remaining production in 1994. However, water
encroachment has occurred along a front downdip. We move the slicer
downward 8 milliseconds (about 30') into the sand, and again we see water
downdip, but production remaining updip. Toward the southernmost well
however, water is appearing at the most updip portion of the sand (coning).
We move the slicer another 8 milliseconds into the reservoir and we are
into the lower lobe. The region grown differences predict water coning has
reached, or is about to reach all 3 wells updip in the K-40 reservoir.
However, much bypassed pay remains downdip in the lower lobe before the
oil/water contact is reached.

