Figure 2 A and B panels

Tuesday, June 2, 2015
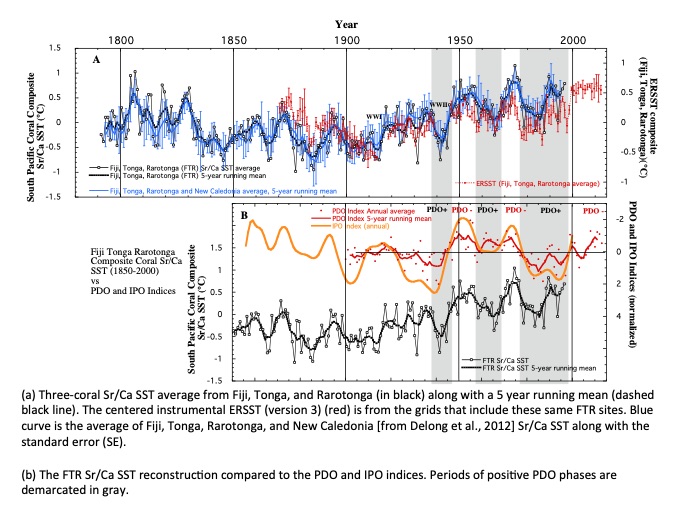
Figure 2. (a) Three-coral Sr/Ca SST average from Fiji, Tonga, and Rarotonga (in black) along with a 5 year running mean (dashed black line). The centered instrumental ERSST (version 3) (red) is from the grids that include these same FTR sites. Blue curve is the average of Fiji, Tonga, Rarotonga, and New Caledonia [from Delong et al., 2012] Sr/Ca SST along with the standard error (SE). (b) The FTR Sr/Ca SST reconstruction compared to the PDO and IPO indices. Periods of positive PDO phases are demarcated in gray.