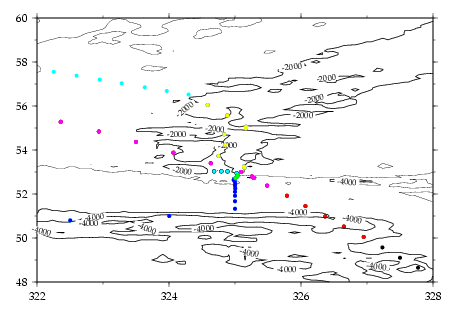
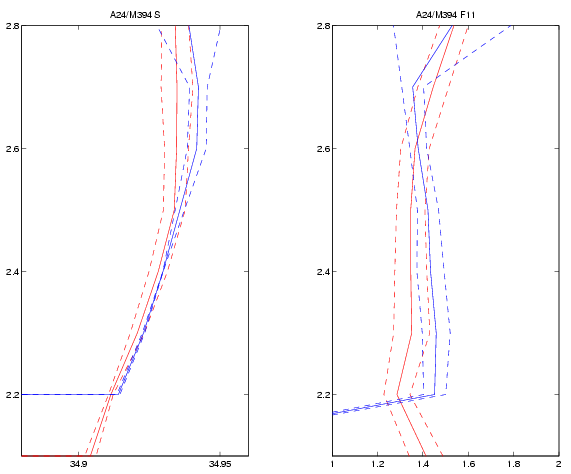
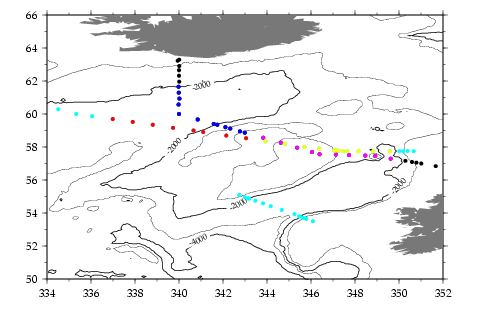
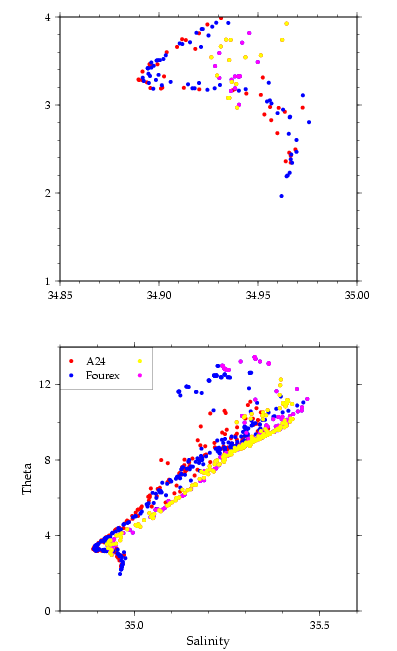
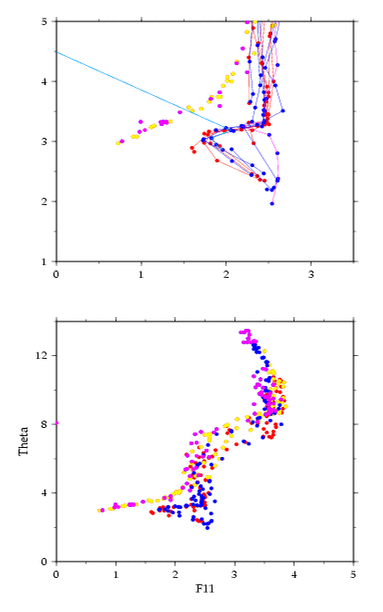
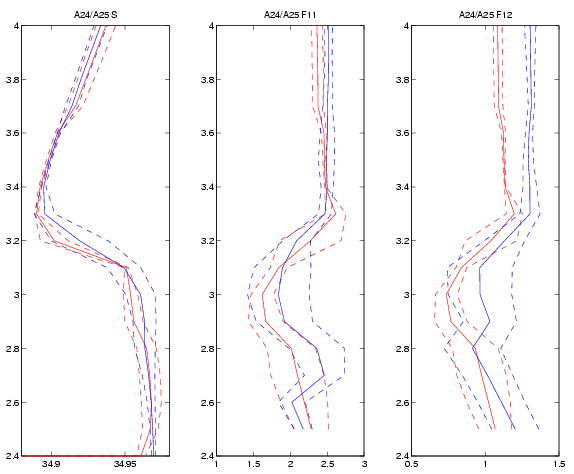
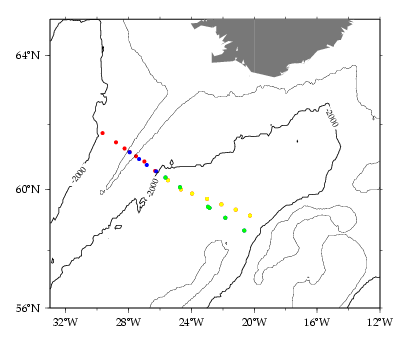
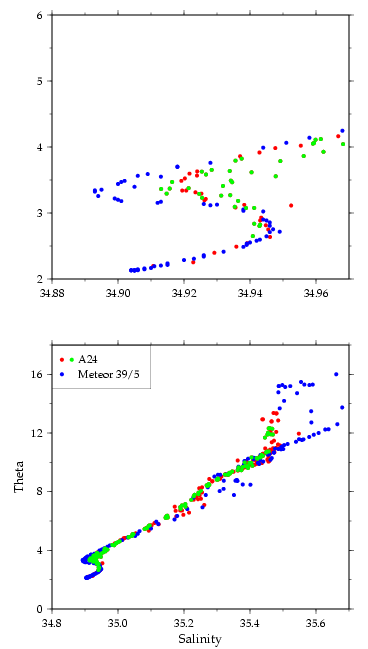
A24 and Meteor 39/2 Crossover
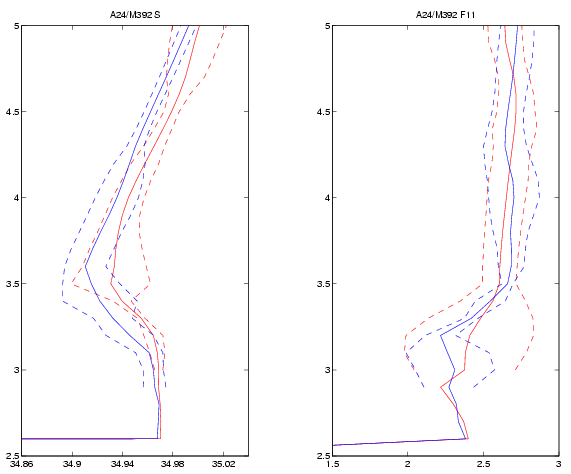

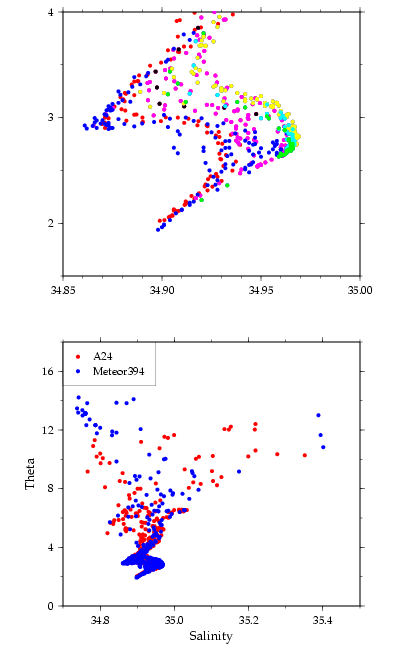
 The Meteor 39/5 values appear to be higher than those from A24; however, these quantitative estimates are fairly uncertain. Data were interpolated to the
2000 m isobath on each section, rather than to a common intersection point.
There was also a limited number of stations available. Finally, we note
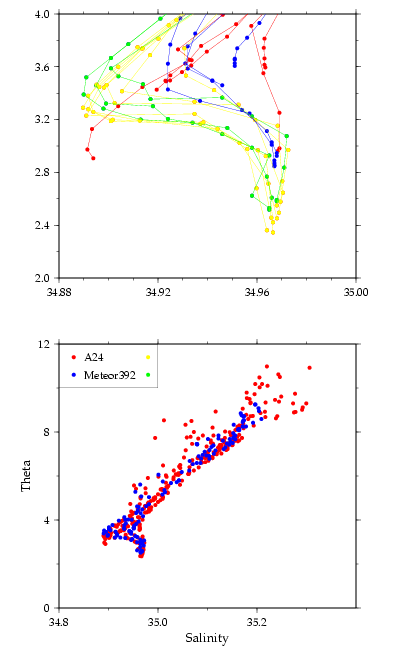
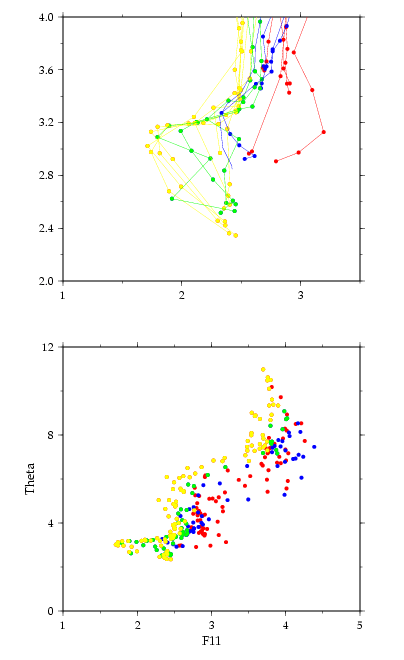
that the CFC maximum and salinity minimum marking the Labrador Sea Water core
seems to be much stronger on Meteor 39/5, suggesting temporal changes or
intense mixing along the flow path. The average salinity difference for
waters below 3C at the cross-over point is less than 0.001.
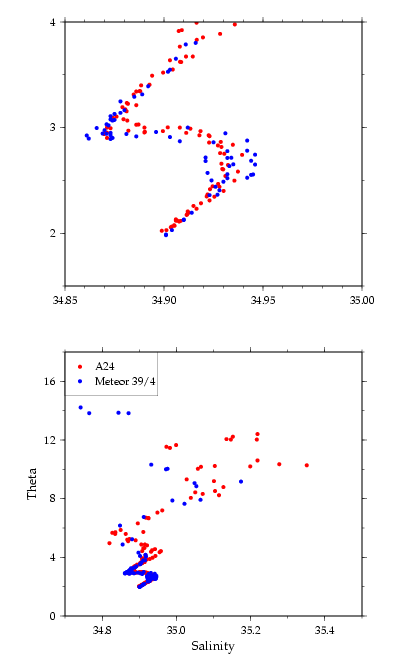
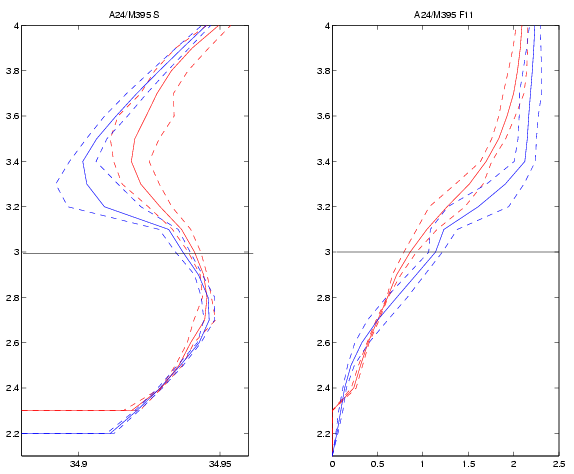
The Meteor 39/5 values appear to be higher than those from A24; however, these quantitative estimates are fairly uncertain. Data were interpolated to the
2000 m isobath on each section, rather than to a common intersection point.
There was also a limited number of stations available. Finally, we note
that the CFC maximum and salinity minimum marking the Labrador Sea Water core
seems to be much stronger on Meteor 39/5, suggesting temporal changes or
intense mixing along the flow path. The average salinity difference for
waters below 3C at the cross-over point is less than 0.001.