A Global Study of Pn Anisotropy Beneath Continents
Gideon P. Smith1, and Göran Ekström
Department of Earth and Planetary Sciences, Harvard University,
Cambridge, MA, USA.
1Now at Department of Earth and Planetary Sciences,
Washington Univ., St. Louis, MO, USA
Journ. Geophys. Res., , in press, 1998.
Abstract
We have applied a two-station method of velocity determination to
Pn arrival times reported in the ISC catalog during the period 1964-93.
The azimuthal variation of these velocities provides evidence of Pn
anisotropy as large as 9.6%. Anisotropic regions are identified by examination of the
azimuthal variation
of the Pn velocities within circular caps of radius
1.5o and 3o , spaced
at 1o intervals across the Earth.
This procedure leads to
255 geographically
distributed estimates of anisotropy.
The length--scale over which the anisotropy varies indicates
that uppermost mantle anisotropy, beneath continents,
is controlled by regional orogenic strains and is inconsistent with
a general interpretation
in terms of plate-scale mantle flow. In addition, the
correlation between Pn
anisotropy and current surface tectonics indicates
that the anisotropy is primarily the
result of ongoing deformation. We compare our Pn
anisotropy results (fast
directions and magnitudes) with those of
SKS splitting studies to attempt to constrain the
depth extent of the anisotropy.
This comparison suggests that in some areas, where the fast
directions agree, SKS splitting
observations may arise from
a layer beginning just below the Moho, whereas in others it must have a
deeper origin. Where the fast directions agree, the
relative magnitudes of the measured anisotropies are consistent with
a thin (100--150 km) lithospheric
layer of anisotropy.
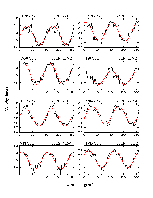
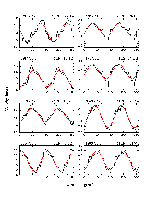
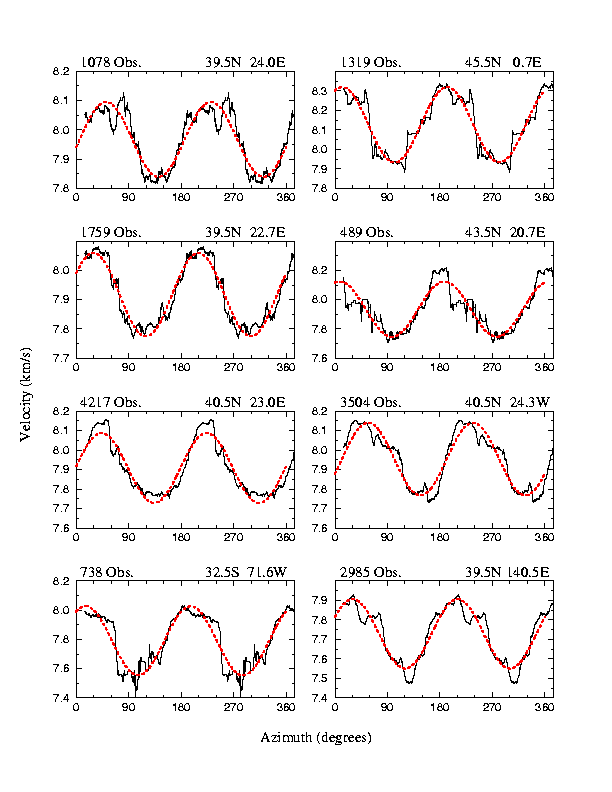
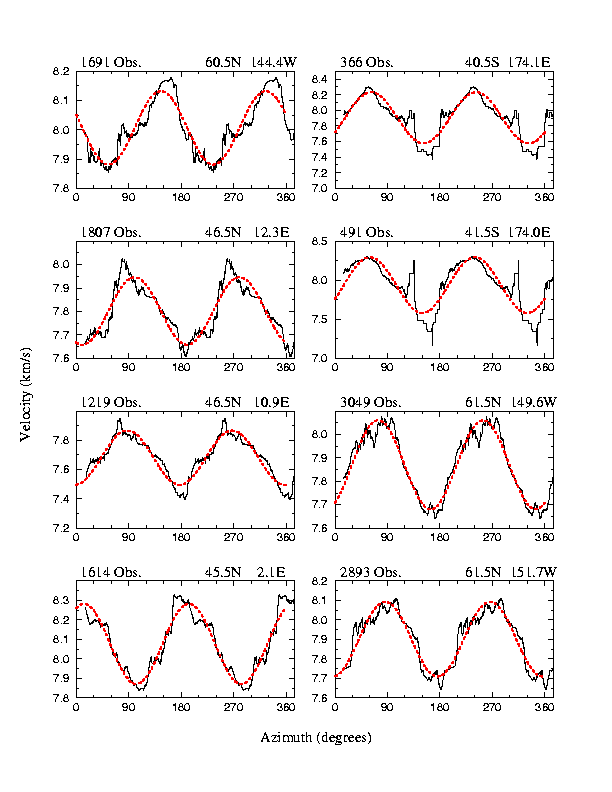
These 2 figures show Pn velocity vs. azimuth for
1.5o caps centered on the locations shown above each plot.
Solid lines are the data, dashed lines are the fit to the data.
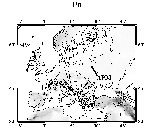
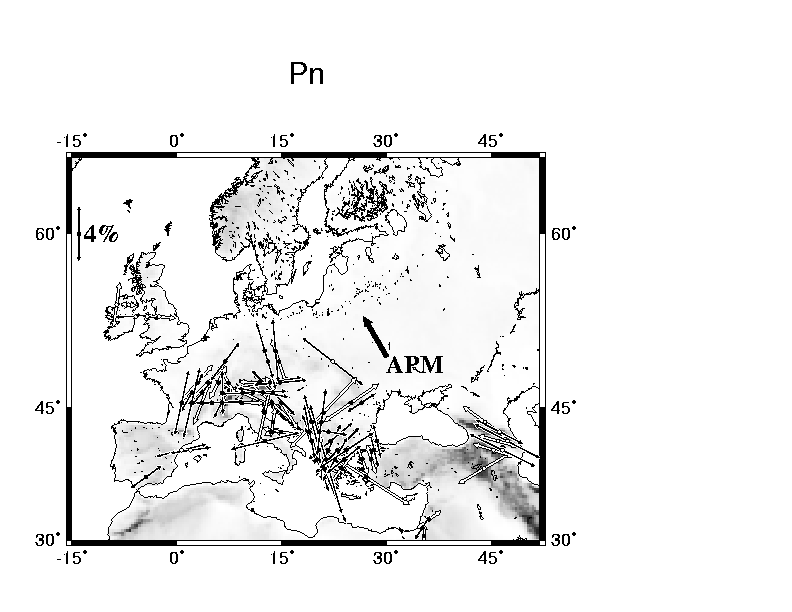
Pn anisotropy results for Europe. The center of each symmetric arrow pair is
plotted at the center of the cap. Arrows point in the direction of fast Pn
propagation and are proportional to the strength of anisotropy. Black and
white center points indicate 1.5o and 3.0o radius
caps respectively. Triangles show the location of null results.
The absolute plate motion vector is also shown. There appears to be
a strong correlation between the fast axes and the strike of mountain chains.
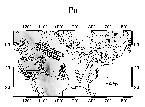
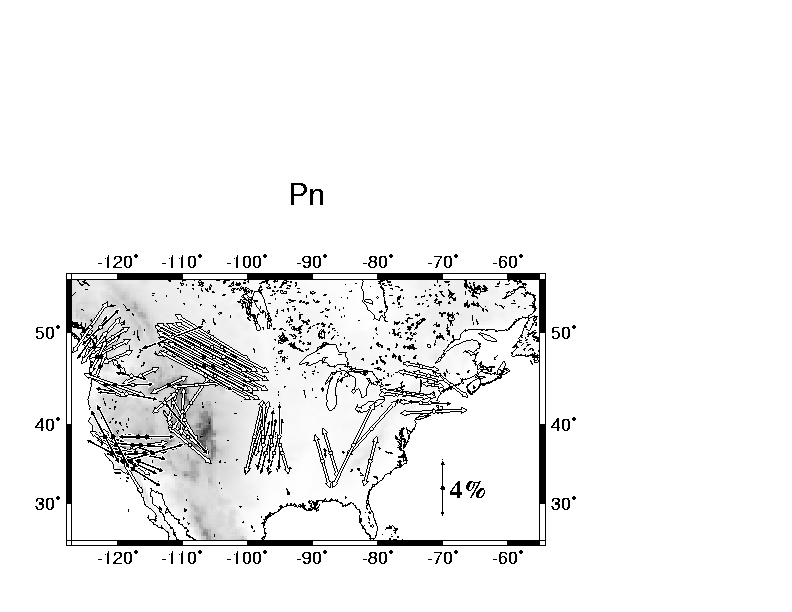
Fast directions of Pn for the U.S.