Ekström, G. , and A. M. Dziewonski, The unique anisotropy of the Pacific upper mantle, Nature, 394, 168-172, 1998.
The development and interpretation of seismic mantle tomographic results has usually proceeded under the assumption that fast and slow velocity anomalies reflect a spatially heterogeneous temperature field controlling, or being controlled by, mantle convection. Implicit in this approach is an assumption that the effect of anisotropy on seismic velocities is small in comparison with isotropic thermal or compositional effects, or that the tomographic results represent the average isotropic heterogeneity, even if individual seismic observations are affected by anisotropic structure. Velocity anomalies in the oceanic mantle are commonly interpreted as reflections of the progressive cooling (and localized re-heating) of a mechanical and thermal boundary layer consisting of the rigid oceanic lithosphere and the underlying less viscous asthenosphere. We show here that the interpretation of seismic velocity anomalies is considerably more complicated for the mantle beneath the central Pacific: in a broad area, with its center near Hawaii, seismic data reveal a regional anomaly in elastic anisotropy which produces variations of seismic velocities that are at least as large as those due to thermal effects. Seismic anisotropy is an independent indicator of strain in Earth materials, and our new tomographic results therefore provide constraints on both the buoyancy forces (thermal effects) and flow patterns in the mantle.
 We construct two models from the original Vsh and
Vsv tomographic maps; one is the isotropic Voigt average, the
second is simply the difference between Vsh and Vsv in an
absolute sense (that is, including the radial anisotropy already
included in PREM).
We construct two models from the original Vsh and
Vsv tomographic maps; one is the isotropic Voigt average, the
second is simply the difference between Vsh and Vsv in an
absolute sense (that is, including the radial anisotropy already
included in PREM).
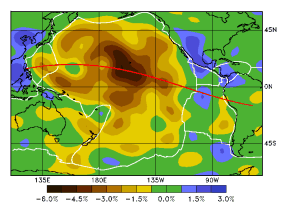
The map to the left shows the anisotropic
variations [(Vsv-Vsh)/Vs in
percent] at 150 km depth in the model S20A, and the location
of the cross section stretching from Indonesia to South America.
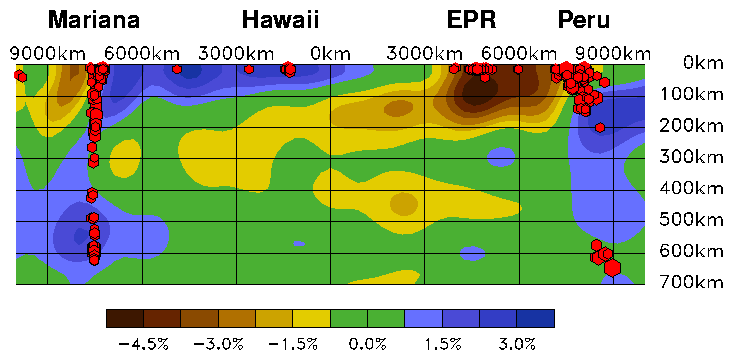
The isotropic cross section is shown together with seismicity. The faster velocities of the subducting lithosphere are clearly imaged both beneath the Mariana Islands and beneath Peru. The cooling and thickening of the lithosphere away from the East Pacific Rise is another clear feature.
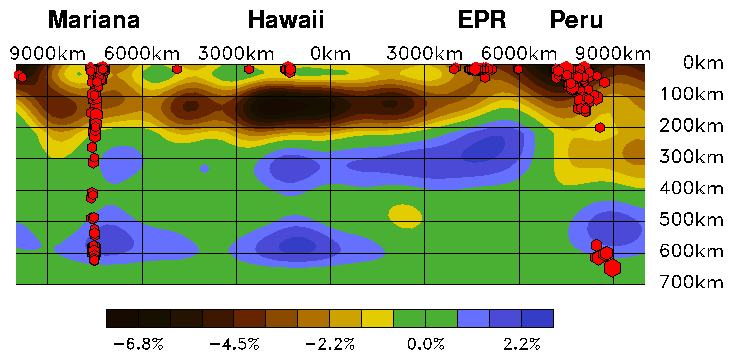
The anisotropic cross section shows the very pronounced anomaly beneath Hawaii in the depth range 125 to 200 km depth. The anisotropic structure is not very well resolved beneath 300 km, but it is intriguing that the regions in the transition zone which show up as having Vsv greater than Vsh are coincident with possible locations for vertical flow.
Coefficients describing the Vsh and Vsv velocity variations of the model S20A are available for downloading.