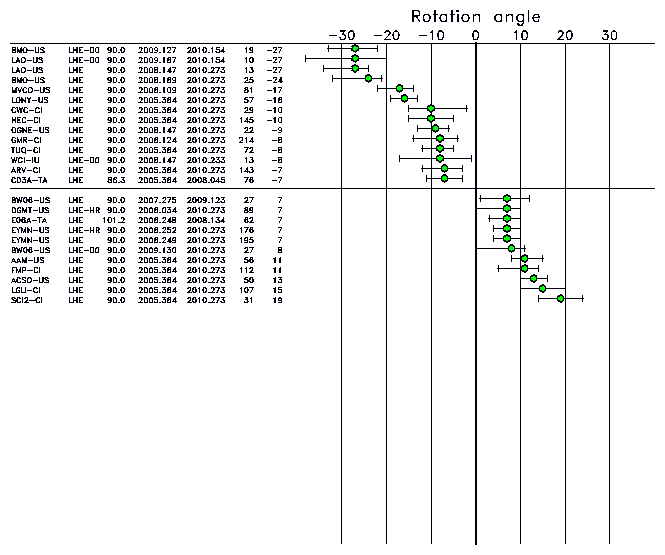
Outliers (by station-response epoch)

The tables below shows the summary results from a polarization analysis of long-period surface waves recorded on USArray and other broadband stations.
| Network | # Obs. | 0-3 degrees | 4-6 degrees | 7-9 degrees | 10-90 degrees | TA | 1054 | 93.6% | 5.5% | 0.9% | 0.0% | US | 75 | 58.7% | 22.7% | 8.0% | 10.7% | IU | 26 | 96.2% | 0.0% | 3.8% | 0.0% | CI | 79 | 59.5% | 16.5 | 11.4% | 12.7% | BK | 22 | 86.4% | 9.1% | 4.5% | 0.0% |
|---|

The figure shows the stations for which the median polarization anomaly is greater than 6 degrees.
| Network | # Obs. | 0-3 degrees | 4-6 degrees | 7-9 degrees | 10-90 degrees | TA | 845 | 95.6% | 4.1% | 0.2% | 0.0% | US | 66 | 57.6% | 21.2% | 9.1% | 12.1% | IU | 24 | 95.8% | 0.0% | 4.2% | 0.0% | CI | 41 | 51.2% | 29.3% | 7.3% | 12.2% | BK | 19 | 94.7% | 5.3% | 0.0% | 0.0% |
|---|

The figure shows the stations for which the median polarization anomaly is greater than 6 degrees.