Signal Power at Digital Broadband Stations Derived from Near Real Time Data
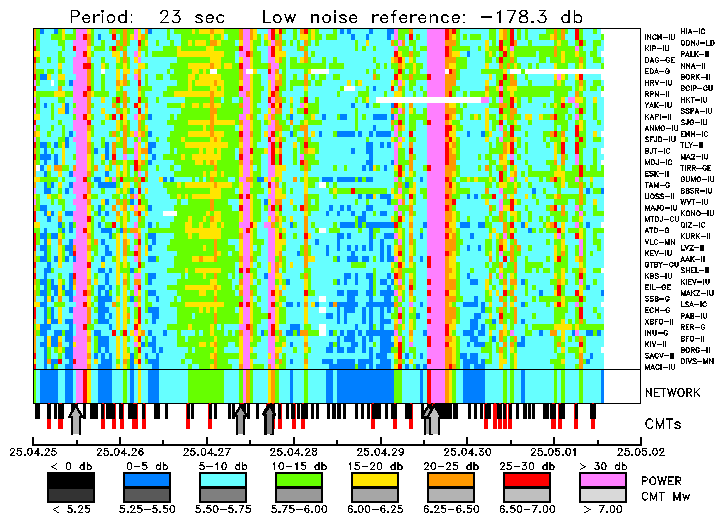
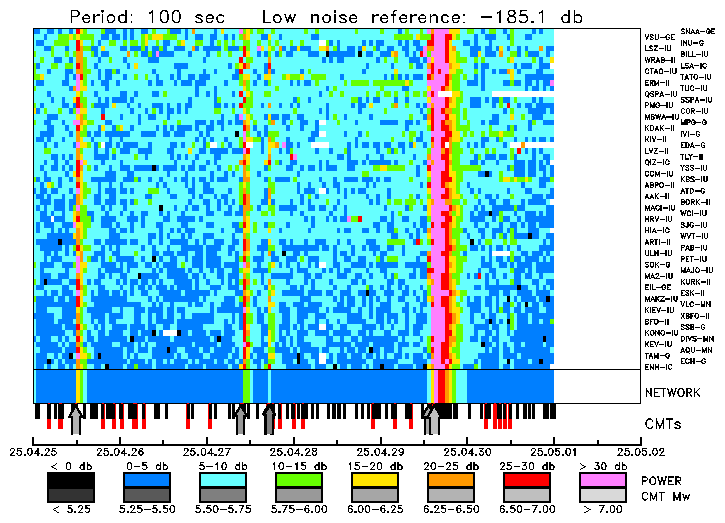
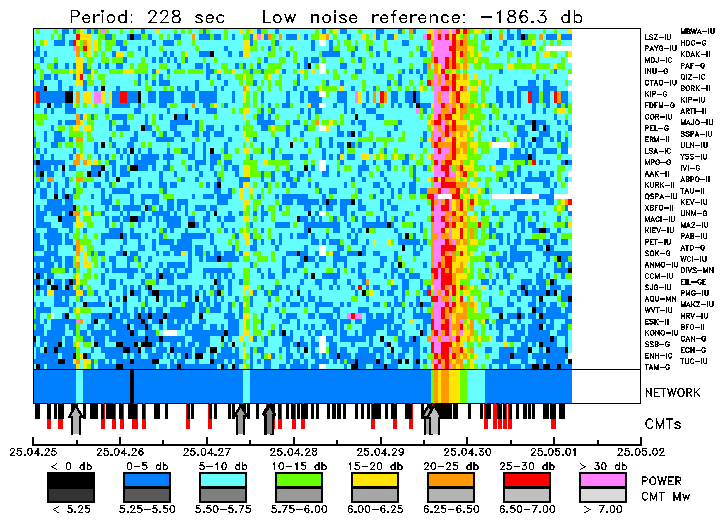
The figures below show the power of the seismic signal recorded at IRIS GSN stations as well as at stations from other US and international networks for which data are retrieved continuously in near real time over the internet using the LISS, NRTS, and Comserv protocols. The signal power in narrow frequency bands is calculated hourly from the rms amplitude of the LHZ (vertical) channel, and converted to a decibel deviation from Peterson's (1993) new low noise model. The stations are ordered with the quietest at the bottom and the noisiest at the top. The times of significant earthquakes, for which a Global Quick CMT solution has been calculated, are indicated by the larger arrows. Darker and thicker arrows are used to represent larger earthquakes. The times of earthquakes with magnitude 4.0 and greater reported by the NEIC are indicated by short black vertical lines. The times of earthquakes detected and located using surface waves are shown with longer red lines.
The figures show the data for the last week and are automatically updated a few times daily.
Intermediate Period

Long Period

Very Long Period
