GIS and Data Visualization
It is often easier to view data in context of other data and I enjoy creating maps. So I am working with a range of tools such as GoogleEarth, ArcGIS, GeoMapApp, and Fledermaus to visualize spatial data in various forms.
3D-Visualization
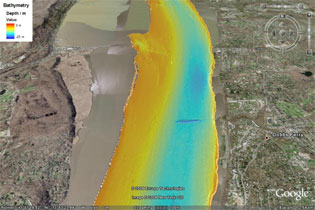
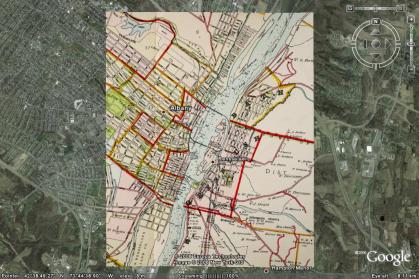
 3D-Visualization of map data as static images (like the Tappan Zea on the left) or as animated movies.
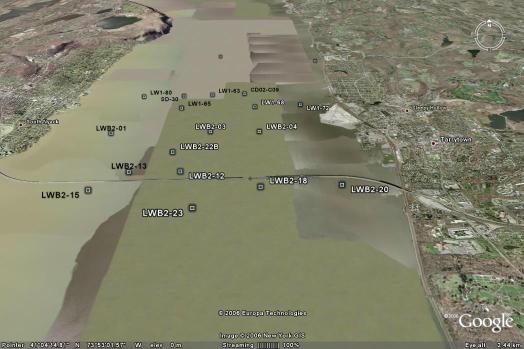
Hudson River Data in GoogleEarth
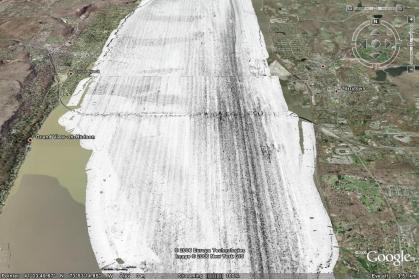
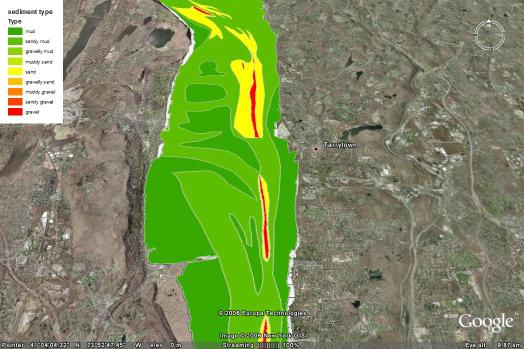
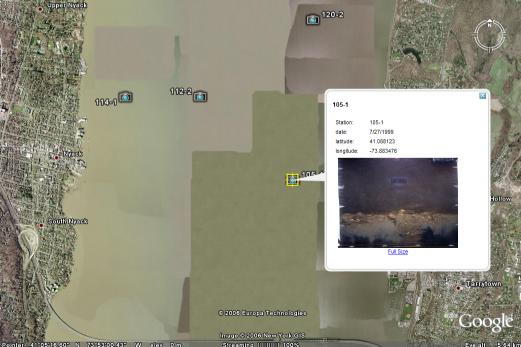
Google Earth does not come with detailed images from the bottom of the Hudson River, but it is easy to add Hudson River data: Click on the file name on the right (KMZ-file) to dowonload the data. Depending on the your setup the data will directly start GoogleEarth or you will download them onto your computer from where you can open them in GoogleEarth.
Here is a set of data examples from the Hudson River Benthic Mapping Project. Most of these examples are in a preliminary stage and cover only a small section of the river. We plan to extend this data set further, however, any comments and suggestions about these data are welcome.
Note: (You need to have GoogleEarth installed on your computer)
 |
|
 |
|
 |
|
 |
|
 |
|
 |
|
 |
How to get GoogleEarth
You need to install GoogleEarth on your computer, if you haven't done so already. It requires a rather recent Computer with Windows XP, Windows 2000 or Mac OS X.)
Download Google Earth at: http://www.google.com/earth//
In collaboration with:
- Stony Brook University
- New York State DEC