Hydrology BC ENV 3025
Global precipitation (evaporation) patterns and variability
1.) Average annual precipitation onto the continents is a function of:
-
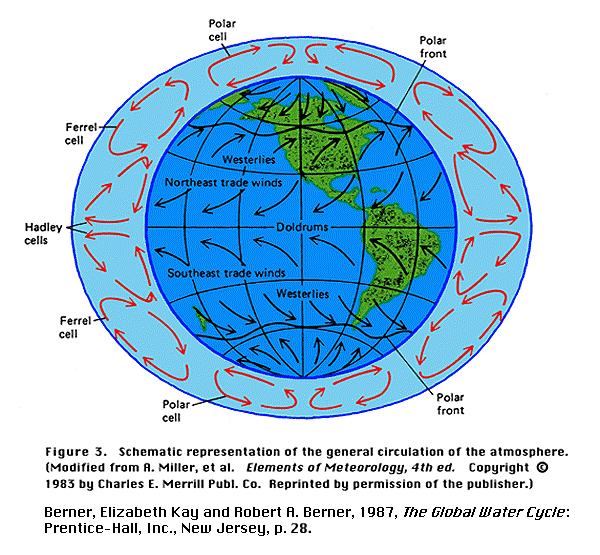
(a) latitude (precipitation highest in latitudes of rising air-0° and
60° north and south-and lowest in latitudes of descending air- 30°
and 90° north and south);
-
global circulation patterns in the atmosphere (Fig)
-
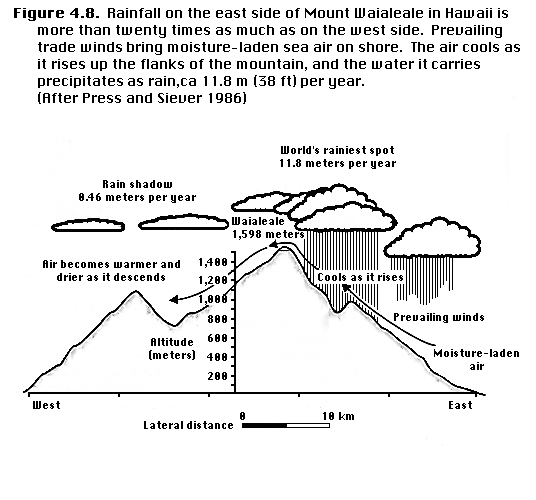
(b) elevation (due to orographic cooling, precipitation usually increases
with elevation) (Fig);
-
(c) distance from moisture sources (precipitation is usually lower at greater
distances from the ocean);
-
(d) position within the continental land mass;
-
(e) prevailing wind direction;
-
global circulation patterns in the atmosphere (Fig)
-
(f) relation to mountain ranges (windward sides typically cloudy and rainy,
with leeward sides typically dry and sunny)
-
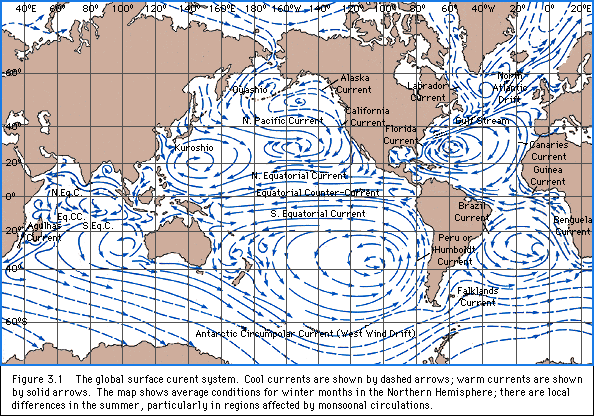
(g) relative temperatures of land and bordering oceans
-
global circulation patterns in the oceans (Fig)
Excercise: look at global (Fig)
and US (Fig) patterns in annual
precipitation and relate them to the above trends. Find five places that
relate to any of those mechanisms mentioned above and be prepared to present
them to the class.
2.) Global patterns in evaporation
Excercise: Analogue to the above, look
at the global patterns of evaporation (Fig),
and explain why it is high for five locations, e.g. Antarctica, western
north Atlantic, northern Africa, the Amazon region. Note: the graph shows
modeled
global precipitation and evaporation, because there is no global network
of stations that measures these parameters everywhere.
3.) Global variability of precipitation
-
world precipitation is extremely variable in time
-
use the National Climate Data Center's database (NCDC
Climate Visualization (CLIMVIS)) to study variability of precipitation
globally and explain the patterns that you see
-
make a histiogram of the daily precipitation for
one of those stations, are the data normally distributed?
4.) Discharge of the Colorado River
-
One historical example illustrates just how important
it is to know the magnitude of hydrological fluxes. In the early part of
this century, rapid growth in the western and southwestern United States
led to efforts to "reclaim" the desert, mostly through management of the
Colorado River. To apportion the flow of the Colorado among the states
that would use the water (the Colorado River Compact of 1922), it was necessary
to determine the amount of water available each year. This was done by
averaging the annual discharge measured at a single point on the Colorado
River over the available period of record (1896-1921), which turned out
to be about 16.8 million acre-feet (an acre-foot is the volume of water
which would cover an acre of land to a depth of one foot, and is approximately
1,233 m3). Unfortunately, this period of time turned out to be a particularly
wet era (or, the following years were particularly dry). From 1922 to 1976,
the average annual discharge of the Colorado River at the gaging station
was 13.9 million acre-feet. When the budget was calculated for the Colorado
River Compact of 1922 and the water apportioned among the states, there
was not enough water to go around! It should be clear that the temporal
and spatial patterns of precipitation and evapotranspiration within the
Colorado River basin strongly influence water availability and hence its
use and management.
-
Find a precipitation station in the catchment area
of the Colorado River that shows this trend in precipitation using the
National Climate Data Center's database (NCDC
Climate Visualization (CLIMVIS)).