Lab Instructions: Atlantic Thermohaline Overturning.
In this lab you will be working with the following datasets:
| mar_SST_NH |
March Sea Surface Temperature, Northern Hemisphere. |
| sept_SST_SH |
September Sea Surface Temperature, Southern Hemisphere. |
| mar_SSS_NH |
March Sea Surface Salinity, Northern Hemisphere. |
| sept_SSS_SH |
September Sea Surface Salinity, Southern Hemisphere. |
| 10S_25W |
10°S, 25°W water column data. |
- We used the March SST, September
SST, March SSS, and September
SSS data sets to create the table below. Note that the first row of each
dataset contains longitude values; the first column contains latitude values.
The sea surface salinity (SSS) datasets have normal East (+) and West (-)
longitudes. The longitudes in the sea surface temperature (SST) datasets are
given as values ranging from 0 to 360 degrees. You can subtract 360 from longitudes
larger than 180 degrees to convert them to a more familiar scale.
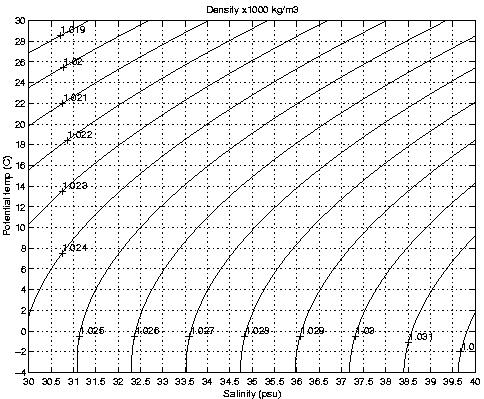
Plot on the T/S diagram distributed in class, the
winter water temperature and salinity values found at the latitude / longitudes
listed below. Note that the Excel listings are by half degree lat/lon. We
have selected the closest to the lat/lon listed below. You might want to
use different colors for northern and southern hemisphere values. Connect
the T/S values with a smooth fit line. The curved lines on the T/S diagram
are lines of equal density or isopycnals.
|
Latitude
|
Longitude
|
salinity
|
temperature
|
|
90°
|
any
|
31.2
|
-1.65
|
|
70°
|
-5°
|
35.1
|
2
|
|
60°
|
-40°
|
34.8
|
4
|
|
45°
|
-40°
|
35.8
|
14.5
|
|
35°
|
-40°
|
36.4
|
17.7
|
|
25°
|
-40°
|
37.2
|
22.4
|
|
15°
|
-40°
|
36.1
|
24.4
|
|
0
|
-30°
|
35.8
|
27.7
|
|
-15°
|
-30°
|
37
|
22.4
|
|
-30°
|
-30°
|
35.8
|
18.9
|
|
-40°
|
-30°
|
35
|
13
|
|
-50°
|
-30°
|
34
|
3.7
|
|
-60°
|
-30°
|
34.2
|
-1.7
|
|
-70°
|
-30°
|
34.4
|
-1.95
|
- Now open the 10°S, 25°W water column data.
Plot on the same T/S diagram the potential temperature and salinity values
of the 10°S, 25°W tropical Atlantic water column (surface to 5500
meters). Using a third color might be a good idea, connect the dots.
- Find the closest T/S match of surface water to water within the 10°S,
25°W water column. The closest match is the most likely source of the
subsurface water. As water likes to spread on density surfaces the sigma-0
lines on the attached T/S may be used to find a match.
- On the map of the Atlantic Ocean locate the likely
surface water sources of the following features listed in order of increasing
depth, within the tropical Atlantic water column:
- Shallow salinity maximum (about 100 meters);
- Salinity-minimum;
- Deep salinity-maximum; and
- Bottom water.
Data
Simulating Ocean Circulation
We will provide you with an aquarium where you will simulate ocean
circulation. Get together in small groups and decide which materials
you will need to complete the following tasks:
- Drive circulation in the aquarium in three different ways.
- Form an intermediate and a deep water mass.
Both goals may be accomplished simultaneously.
Sketch and describe what is happening in the aquarium at each step along the
way. Sketch the vertical cross section of the flow in the tank. Label the temperature/salt
content and the flow direction in each layer. Measure the depths of the thermocline
and halocline and label them in the appropriate sketches.
Calculate the horizontal and vertical velocities in each of the three different
cases. Include these numbers in your lab report.
Comparison to Real Ocean Conditions
Considering what you know already about the Earth's climate, and what
you have seen today in lab, incorporate the answers to these questions in
your lab report:
- Where in the real world do the processes you simulated occur? How do the
conditions in the aquarium differ from those found in nature?
- What steers the currents in the lab experiment? How does that compare
with conditions in nature?
- Which currents were the fastest and which were the slowest? Is this the
same as in the real ocean?
Lab Report Instructions
- Write a lab report (as per the Lab Report Format) summarizing the major findings of
your investigation.