Climate and water
Streams, floods and droughts
Take away ideas and understandings:
-
The water cycle is characterized by extreme events in magnitude and length.
-
The main characteristic of a river is its hydrograph, the discharge rate
(or stage) as a function of time.
-
The magnitude and frequency of extreme events can be predicted in a probabilistic
way.
-
To some extent, the past can be the key to the future, with lots of caveats.
Introduction
-
extremes in hydrology take many forms, from extremes
in magnitude and length
-
by definition, an extreme event must be rare and
unusual
-
magnitude and frequency of extreme events can be
estimated from ordinary, not as severe events
-
floods are very important issues all over the world
-
current examples: Venezuela, Mozambique, Hurricane
Floyd
The nature and causes of floods (and droughts)
-
extreme floods occur when a river overtops its banks
and flows across the floodplain
-
for a hydrologist, a flood is a discharge rate that
execeeds some threshold value
-
in rivers, floods and low flows are expressions of
the temporal variability in rainfall or snowmelt interacting with river
basin characteristics (basin form, hillslope properties, channel network
properties)
-
flooding may also be the result of sudden release
of water from dams or lakes, ice jams
-
floods cause the biggest natural hazard damage in
the US, example: Mississippi flood, 1993
-
definition of a drought even more difficult than
the definition of floods
-
British Rainfall Organization: absolute drought =
15 consecutive days with less than 0.25mm/day on any day, partial drought:
at least 29 consecutive days with a mean rainfall less than 0.25mm/day
-
agricultural droughts: 'at least a partial crop failure'
-
hydrological drought: actual flow in the rivers is
of most concern; length and extremeness of flow below a certain level are
important ; e.g.: low flows of 10-day duration that occur no more than
5% of the time
-
droughts mostly related to abberations in the weather
The hydrograph
-
a graph of river stage or discharge versus time at
a point is called a stage or discharge hydrograph (Fig5.1)
-
there are about 6000 gaging stations in the US that
typically measure stage, which needs to be converted into discharge rate
using a calibration or rating curve (Fig5.3,
Snake River in Colorado, Q = 76.5*stage4.1), dimensions!
-
a typical hyetograph and hydrograph of a creek in
VA (Fig5.4)
-
peaks in the hydrograph are called floods,
background discharge between peaks is called baseflow
-
differences in hydrographs of three streams (Fig5.5)
Flood prediction
-
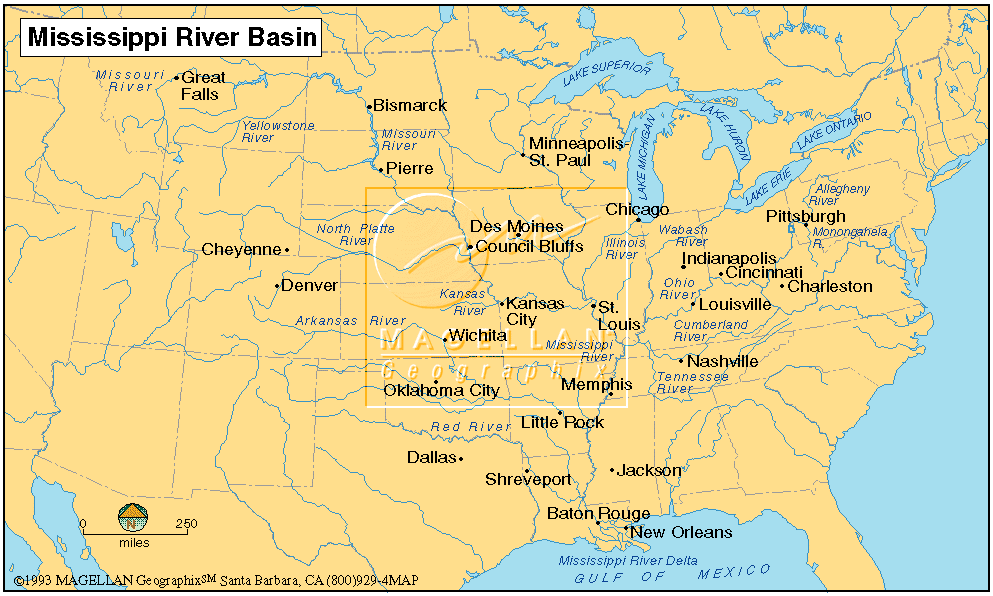
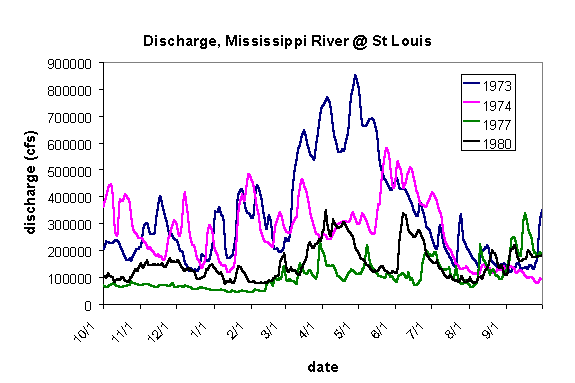
Student Excercise: How can we predict extreme
events? Download the daily discharge rate data for the Mississippi at St
Louis, MO, (St_Louis_daily_70s.tsv).
Convert the file into an EXCEL spreadsheet and plot the timeseries of the
discharge. Consider overlaying the data for all 10 water years. Also look
at a map that shows the Mississippi River Basin (Fig).
Can you see any patterns? When do flood occur and why? How could you predict
floods? This Fig shows the discharge
rate for 4 years in the 1970s.
Flood routing
-
movement of flood waves, complicated as a result
of many factors, which?
-
example: Flooding in Central
Virginia, June, 1995
-
flood warning and flood mitigation depends on how
quickly a flood crest travels downstream and how high it gets; example:
nested basins of the Potomac river (Fig5.6)
-
flood routing: prediction of downstream hydrograph,
if the upstream hydrograph is known
-
flood routing in rivers and by reservoirs
-
dV/dt = I-O
-
we will explore the case of reservoir routing
(Fig5.7), see Explore5.doc
excercise
-
we can adjust the dimensions of the reservoir (Fig5.8)
and the initial conditions and look at the relationship between inflow
and outflow (Fig5.10)
Flood frequency analysis
-
simplest approach: use worst event on record
-
past record key for the future? Statistical techniques
use
the following approach
-
highest discharges recorded in each year are listed
-
the floods are ranked according to magnitude, the
largest flood is assigned a rank 1, the second largest rank 2, etc
-
The flood statistics are estimated graphically by
plotting on normal probability paper the logarithm of discharge for each
flood in the annual series against the fraction of floods greater than
or equal to that flood; this fraction is given by r/(n+1), where r is
the rank of the particular flood (Fig5.13)
-
r/(n+1) is the exceedence probability for this particular
event
-
the return period, the average span of time between
any flood and one equaling or exceeding it, is calculated as Treturn =
1/(exceedance probability).
-
the 100 year flood can then be estimated from the
graph
-
example: Holiday
Creek, VA (Fig5.13)
-
normal distribution works often well with precipitation
data, ln normal for discharge
-
problems: not deterministic, based usually on non-adequate
data, climate and terrestrial environment is variable
Teleconnections
-
most techniques described above tend to treat floods
or droughts as random events in a stationary series. However, climate and
riverflow are clearly non-stationary and follow trends and cycles
-
example: The 1922 Colorado Compact apportioned water
rights on the basis of the average discharge from 1896-1930 (21 billion
m3/y) while in 1931-65, the discharge rate was 16 billion m3/y
-
examples for teleconnections: El
Nino, possibly sunspot cycles, some of these are quite controversial
Resources
SAST Home Page and
Geographic Information Systems (GIS) Server
Mississippi
River At St Louis Mo
NOAA/OGP El Niño-Southern
Oscillation Page
Mississippi
River Flood, lecture by David McConnell
US Army Corps
of Engineers 1993 Flood Home Page
Landsat TM Color Composite
Images: Flood
Lower Mississippi River
Forecast Center - river flood forecasts rainfall data navigation
The Great
USA Flood of 1993