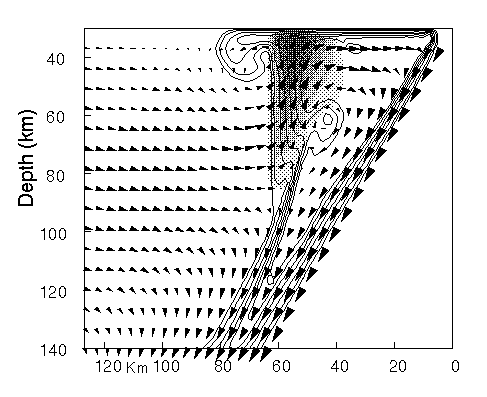

Fig 3. Fig. 3. Geodynamic model of a subduction zone, showing mantle flow lines (arrows), temperatures (contours) and melt region (shaded). This model presumes that the fluids are released from the slab down to a depth of 100 km. Upwelling is driven by melt bouyancy. (PostScript version)