Summary of Crustal Thickness Measurements in Northwestern Iceland
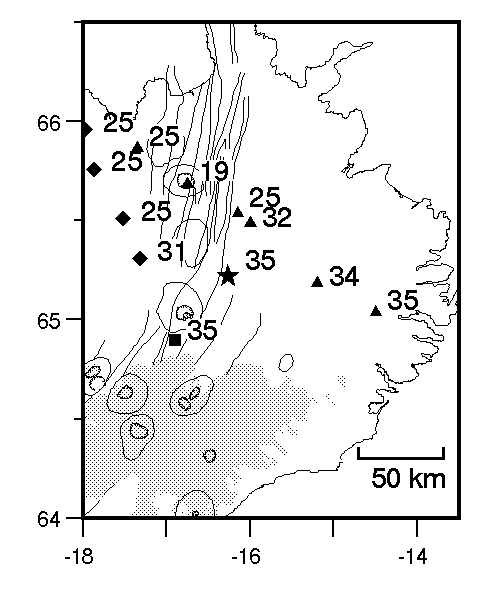
Fig 1: Map of northwestern Iceland showing fissure swarms (line), central volcanos (curcular outlines), glaciers (shaded), and selected crustal thickness measurements (annotated triangles). Letters in paranthesis refer to data sources: (a) Our reinterpretation of Gebrande et al. [1980]; (b) Menke et al.'s [1996] reinterpretation of Gebrande et al. [1980]; (c) Staples et al. [1997]; and (d) B96 results. (PostScript version).
References
Notes
Gebrande et al. (1980) give a record section for a shot D (their
figure 1) showing a weak secondary arrival that we, following Bjarnason
et al. (1993), interpret as PmP. It has a reduced arrival time of 4.0s at 100 km
range, and 3.1 s at 150 km range (reduced to 7.0 km/s). Assuming a SIST-like
crustal velocity model, the crustal thickness is about 35 km.