Welcome to UserCalc version 2.0. A
web-based Uranium series calculator based on the
models of Spiegelman and Elliott, 1993. A full
description of the model and a rationale for this web-site can be
found in the PDF document here. The remainder of this page will
provide enough background and hints on the use of this web-site to get
started exploring the wide range of behaviour inherent in this
model.
Outline
The Model
This section describes the different components of the models and this web-site. You can read the manual or go directly to the models and start hacking around
General Properties

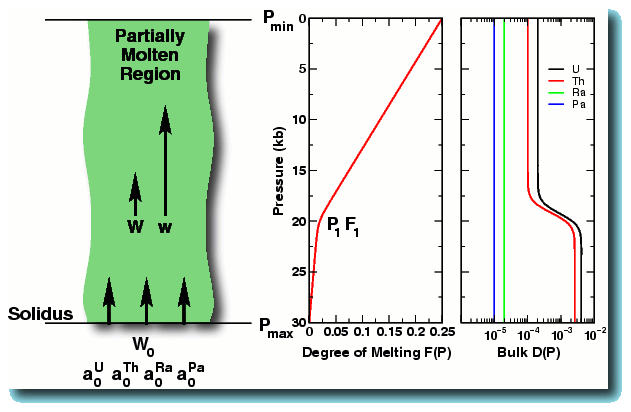
This model calculates the concentrations and activity ratios for the two parallel Uranium Series decay chains 238U->230Th->226Ra and 235U->231Pa in a one dimensional upwelling and melting column. The principal user inputs into this model are
- W0: the solid upwelling rate at the base of the column
- F(P):the degree of melting in the column as a function of pressure
- Phimax: The maximum porosity at the top of the column
- D(P): bulk partition coefficients for the 4 elements (U,Th,Ra,Pa) as a function of pressure
- a0: the initial activity ratios of the elements in the solid (Spiegelman and Elliott, assumed secular equilibrium such that a0=1)
Melting is assumed to occur by adiabatic decompression
at a melting rate proportional to
W0dF/dz. The porosity throughout the
column is determined by the balance of melting and melt
extraction, which is primarily controlled by the
permeability. The permeability is assumed to scale as
kr(P) Phin Where. n is
the "permeability exponent" and kr(P) is
a "enhanced permeability
factor" which can be a function of position in the
column. Given the upwelling rate, the maximum porosity at
the top of the column, the degree of melting and the
permeability factors, the porosity is determined
everywhere in the column. Given F(P) and
Phi(P), a useful rule of thumb for the ratio of the
melt velocity relative to the upwelling velocity at any
height is w/W~F(P)/Phi(P). (see Spiegelman, 2000
for more details)
In these models, the degree of melting, the partition coefficients and the permeability factor can all be arbitrary functions of pressure. They are input into the models as a tab or space separated spreadsheet supplied by the user. Sample spreadsheets are supplied for all models and a more general 2-layer model can be generated using the Spreadsheet Calculator
1-D column calculator
This model calculates the vertical porosity and concentration profiles for a single 1-D upwelling column. If requested, this module also produces simple XY graphs and returns output as comma separated spreadsheets, EPS files and/or PDF files.
Contour plot calculator
This is the more interesting model. It runs a series of 1-D columns that have the same melting and partition coefficient structure but are calculated over a 2-D grid of values of upwelling rate and maximum porosity. (The user chooses the range of velocities and porosities and the number of points in each direction). The activity ratios and concentrations of each nuclide in the melt at the top of each column is gridded and made available in a variety of formats. If requested, contour plots of activity ratios at the top of the column are also made for the three principal parent-daughter pairs.
The contour calculator also allows the user to input target values and ranges for measured activity ratios of (230Th/238U), (226Ra/230Th), and (231Pa/235U). These specific contours are superposed on the model plots and on each other. Valid solutions that are consistent with the target data will be regions where all three contours cross. Because of the coupled nature of these different ratios, finding valid regions of parameter space can be quite a challenge suggesting that these sorts of measurements can place strong constraints on mantle processes. The main purpose of this web-site is to allow any user to easily compare their data to theory and map out the inferences and viability (or not), of this simple model.
Hints for Users
- Using the navigation bar to move to different models, resets the forms. Use the back button if you want to retain information from previous forms (sorry, HTML is stateless and I don't want to use cookies)
- In contour plot mode, the first columns with slow upwelling rates and small porosities take the longest to calculate. Be patient...the calculation speeds up with time.
- Larger daughter/parent activity ratios are produced when the parent nuclide has a longer residence time in the column than the daughter. This happens most readily when the porosity is comparable or smaller than the parent bulk partition coefficient.
- The melt velocity relative to the solid velocity (w0/W0) is approximately F/phi. Thus small porosities relative to the degree of melting imply faster melt velocities and larger possible differences in residence times
Usage Etiquette/Policy
- This site is provided free of charge, as is, bugs and all. Go knock your socks off. If you find this site useful in your work, the appropriate citation is Spiegelman, M. (2000), UserCalc: a web-based Uranium series calculator for magma-migration problems, G3 (submitted)
- All comments, bug-reports, wish-lists, and hate-mail are gratefully accepted. However, a response is not guaranteed.
- Warning: Significant requests for my time, interpretation of model results or interesting scientific discussions will result in co-authorship.
Credits and Acknowledgements
This site was cobbled together using a vast array of freely available and extremely useful software. Grateful credits go to:
| Editor in Chief: | XEmacs |
| Image Manipulation: | XV, The Gimp, Ghostscript, NetPBMtools |
| 1-D Column Graphics: | Grace, XFig |
| Contour Plots: | GMT |
| Best Boy: | Tim Elliott |
| Financial Backing: | The NSF, LDEO/Columbia |