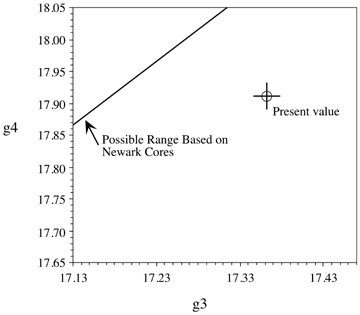
Figure 2: Range of possible g3 and g4 values based on the Newark cores and limited by the size of the chaotic zone as defined by Laskar (1990) for the last 200 million years and possible range of those values that satify the data from the NBCP cores (from Olsen and Kent, 1999a).


