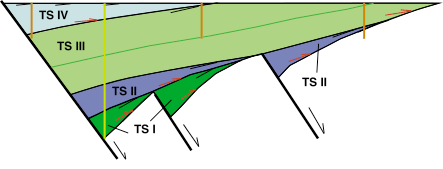
| Figure 5: Idealized rift basin showing unconformity-bounded tectonostratigraphic packages. Thin black lines represent stratal truncation beneath unconformities; red half-arrows represent onlaps. TS I and TS II are much more areally restricted and more wedge-shaped than TS III. The transition between TS III and TS IV is likely related to an increase in extension rate. An offset coring technique (vertical orange lines), as used in NBCP, does not sample TS I and most of TS II. A deep core (vertical yellow line) is necessary to recover TS I & II. Modified from Olsen (1997). |
 |