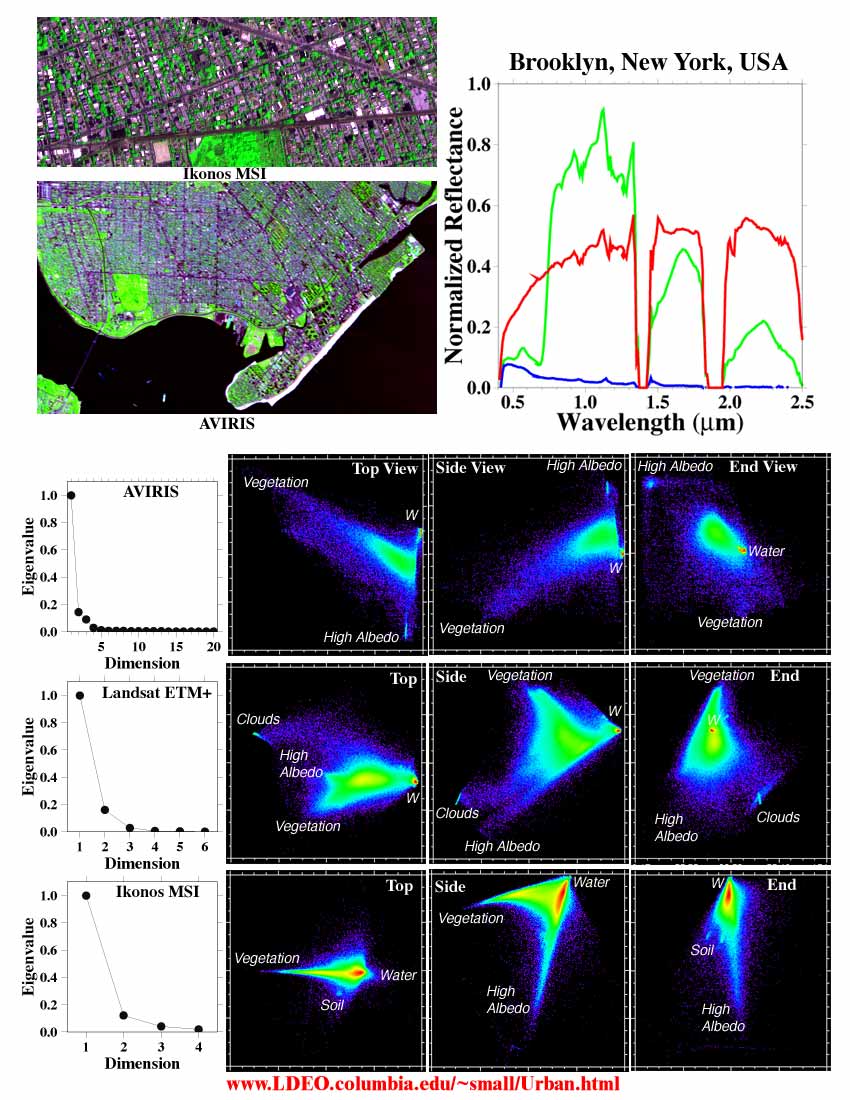
Multisensor analysis of the spectral mixing space for Brooklyn, New York, USA. False-color composites for AVIRIS (20m, RGB=2.2/0.8/0.5 mm) and Ikonos MSI (4m, RGB=0.6/0.8/0.4 mm) show different degrees of spectral mixing. AVIRIS spectra show the High Albedo (red), Low Albedo (blue) and vegetation (green) endmembers residing at the apexes of the mixing space. The eigenvalue distributions for each sensor (left column) indicate that most of the variance is contained in the first two dimensions corresponding to the principal components shown in the Side View scatterplot. The topology of the three dominant dimensions of the mixing space is shown by the scatterplots as different projections of the 3D cloud of pixels associated with the three low order principal components. The side view shows the first (x) and second (y) dimensions while the top and end views incorporate the third dimension. The variance of each dimension is proportional to the relative amplitude of the normalized eigenvalues but the dimensions are rescaled here to show the structure more clearly. In each case, the horizontal axis of the side view is associated with the most distinct endmembers so the distributions would appear as sub-planar triangles if plotted to scale.