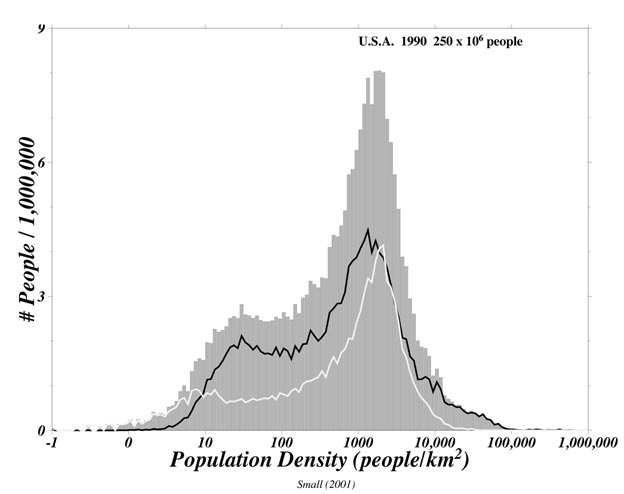
The population density distribution is bimodal with modes corresponding to spatially clustered and dispersed settlements.
The gray histogram shows the distribution of population densities corresponding to block level census estimates for 1990. The black and white curves shows the density distributions of blocks east and west of the 90° meridian respectively. Note that the distributions are shown on a logarithmic scale.