dNYC / Annual Vegetation Phenology
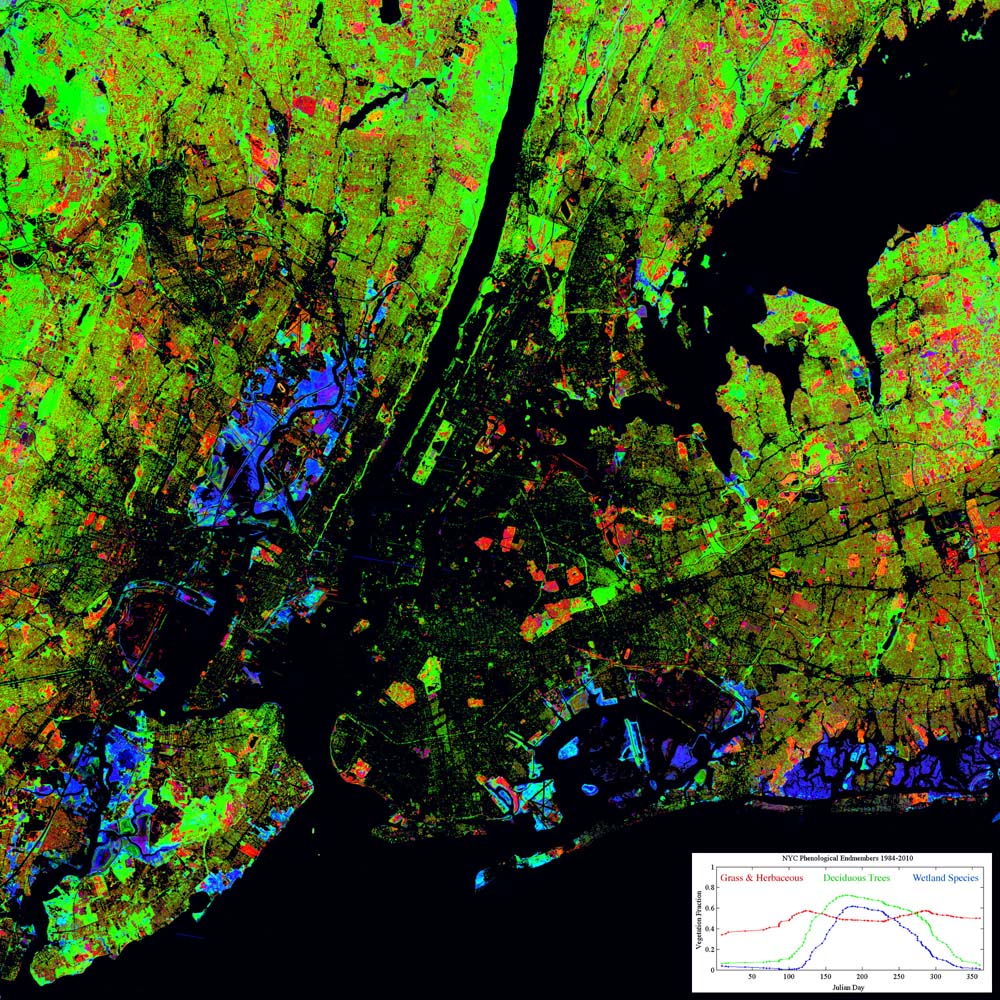
| Vegetation phenology map derived from temporal mixture model of vegetation fraction image time series. Vegetation fractions are derived from spectral mixture models of 97 Landsat 5 & 7 acquisitions between 1984 and 2010. Mixtures of red, green and blue on the map correspond to phenological mixtures of grass, deciduous trees and wetland vegetation having average annual phenological signatures shown in the plot at the bottom of the image. Because the pixel time series are based on a single composite year containing images collected over 26 years, changes in vegetation occurring within this time may obscure the phenology in areas where the changes occur. See the accompanying decadal change map for the locations of interannual changes in vegetation cover. For details on temporal mixture modeling, see: Small, C., Spatiotemporal dimensionality and time-space characterization of multitemporal imagery, Remote Sensing of Environment, 124, p.793-809, 2012.
| Download
|