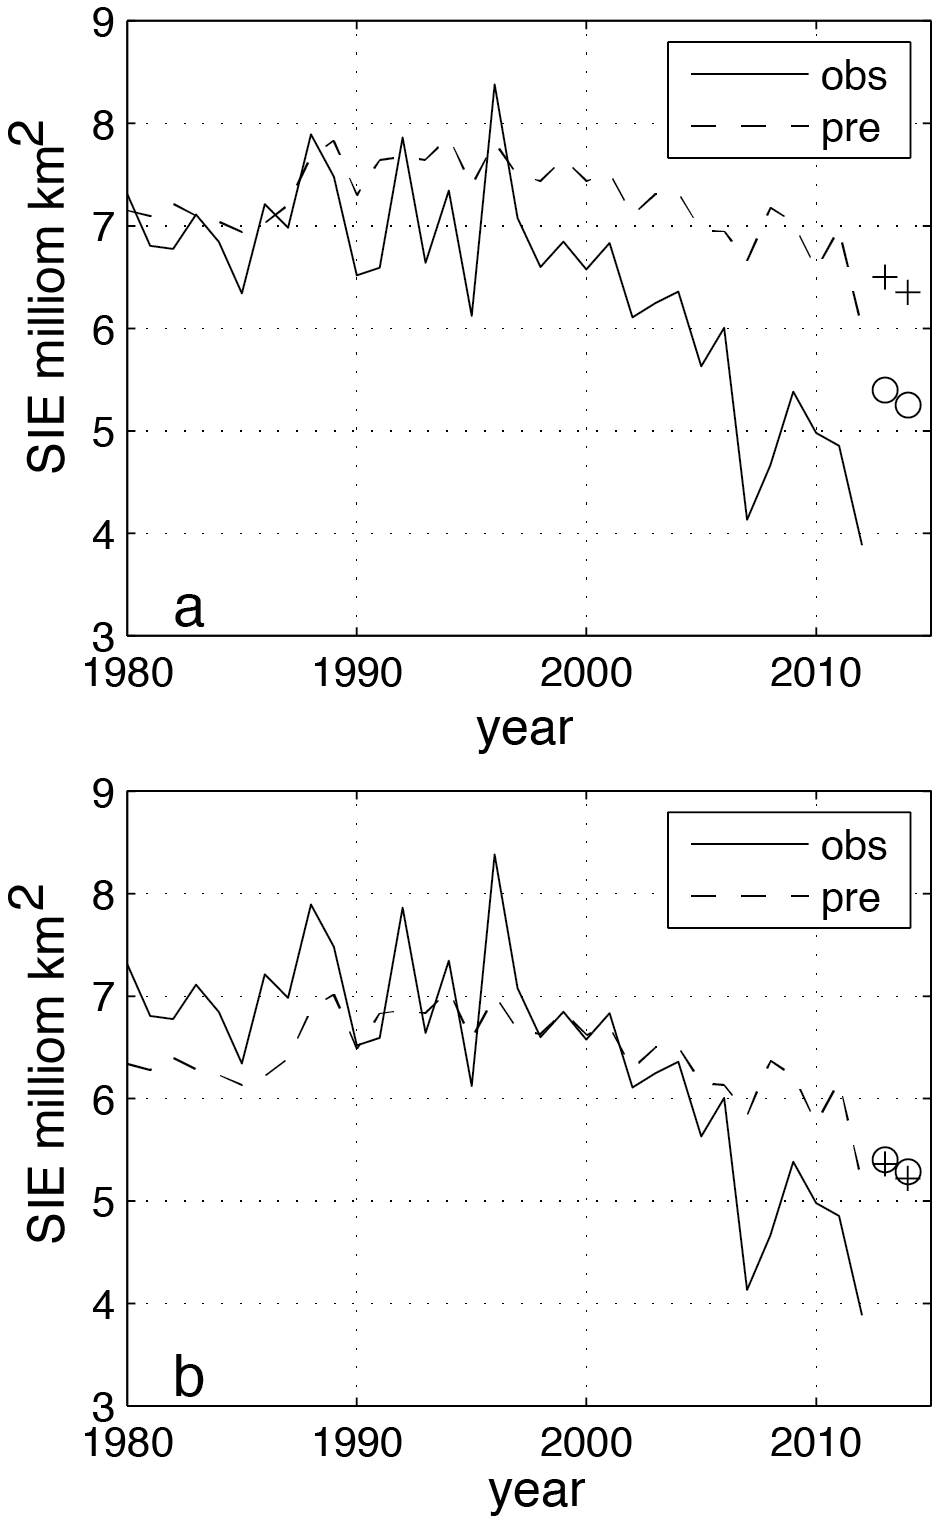
 Figure 2. (a) Raw cross-validated predictions at four-month lead time (red line) and observations (blue) of September Arctic sea ice extent from 1980 to 2012 . (b) Same as (a) but predictions are corrected by a constant model bias. Forecasts (red) and observations (blue) for September 2013 (circles) and September 2014 (crosses) are marked in both (a) and (b), respectively.