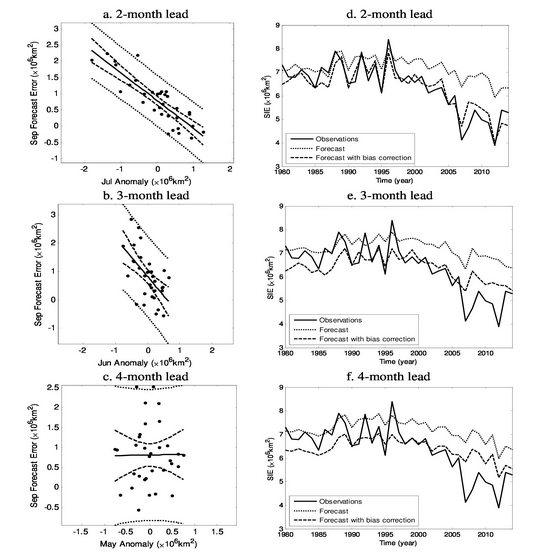
 Figure 3. (a) Scatter plot of the 2-month lead forecast errors of September SIE as function of July SIE anomalies. (b)Same as (a) but for the 3-month lead. (c) Same as (a) but for the 4-month lead. The solid line represents the linear fit of the data and the dashed (dotted) curves show the 95% confidence interval of the fit (predicted bias). (d-e) Two, three and four-month lead forecasts of the September SIE without (dotted lines) and with (dashed lines) regression bias corrections, compared with observations (solid), respectively.