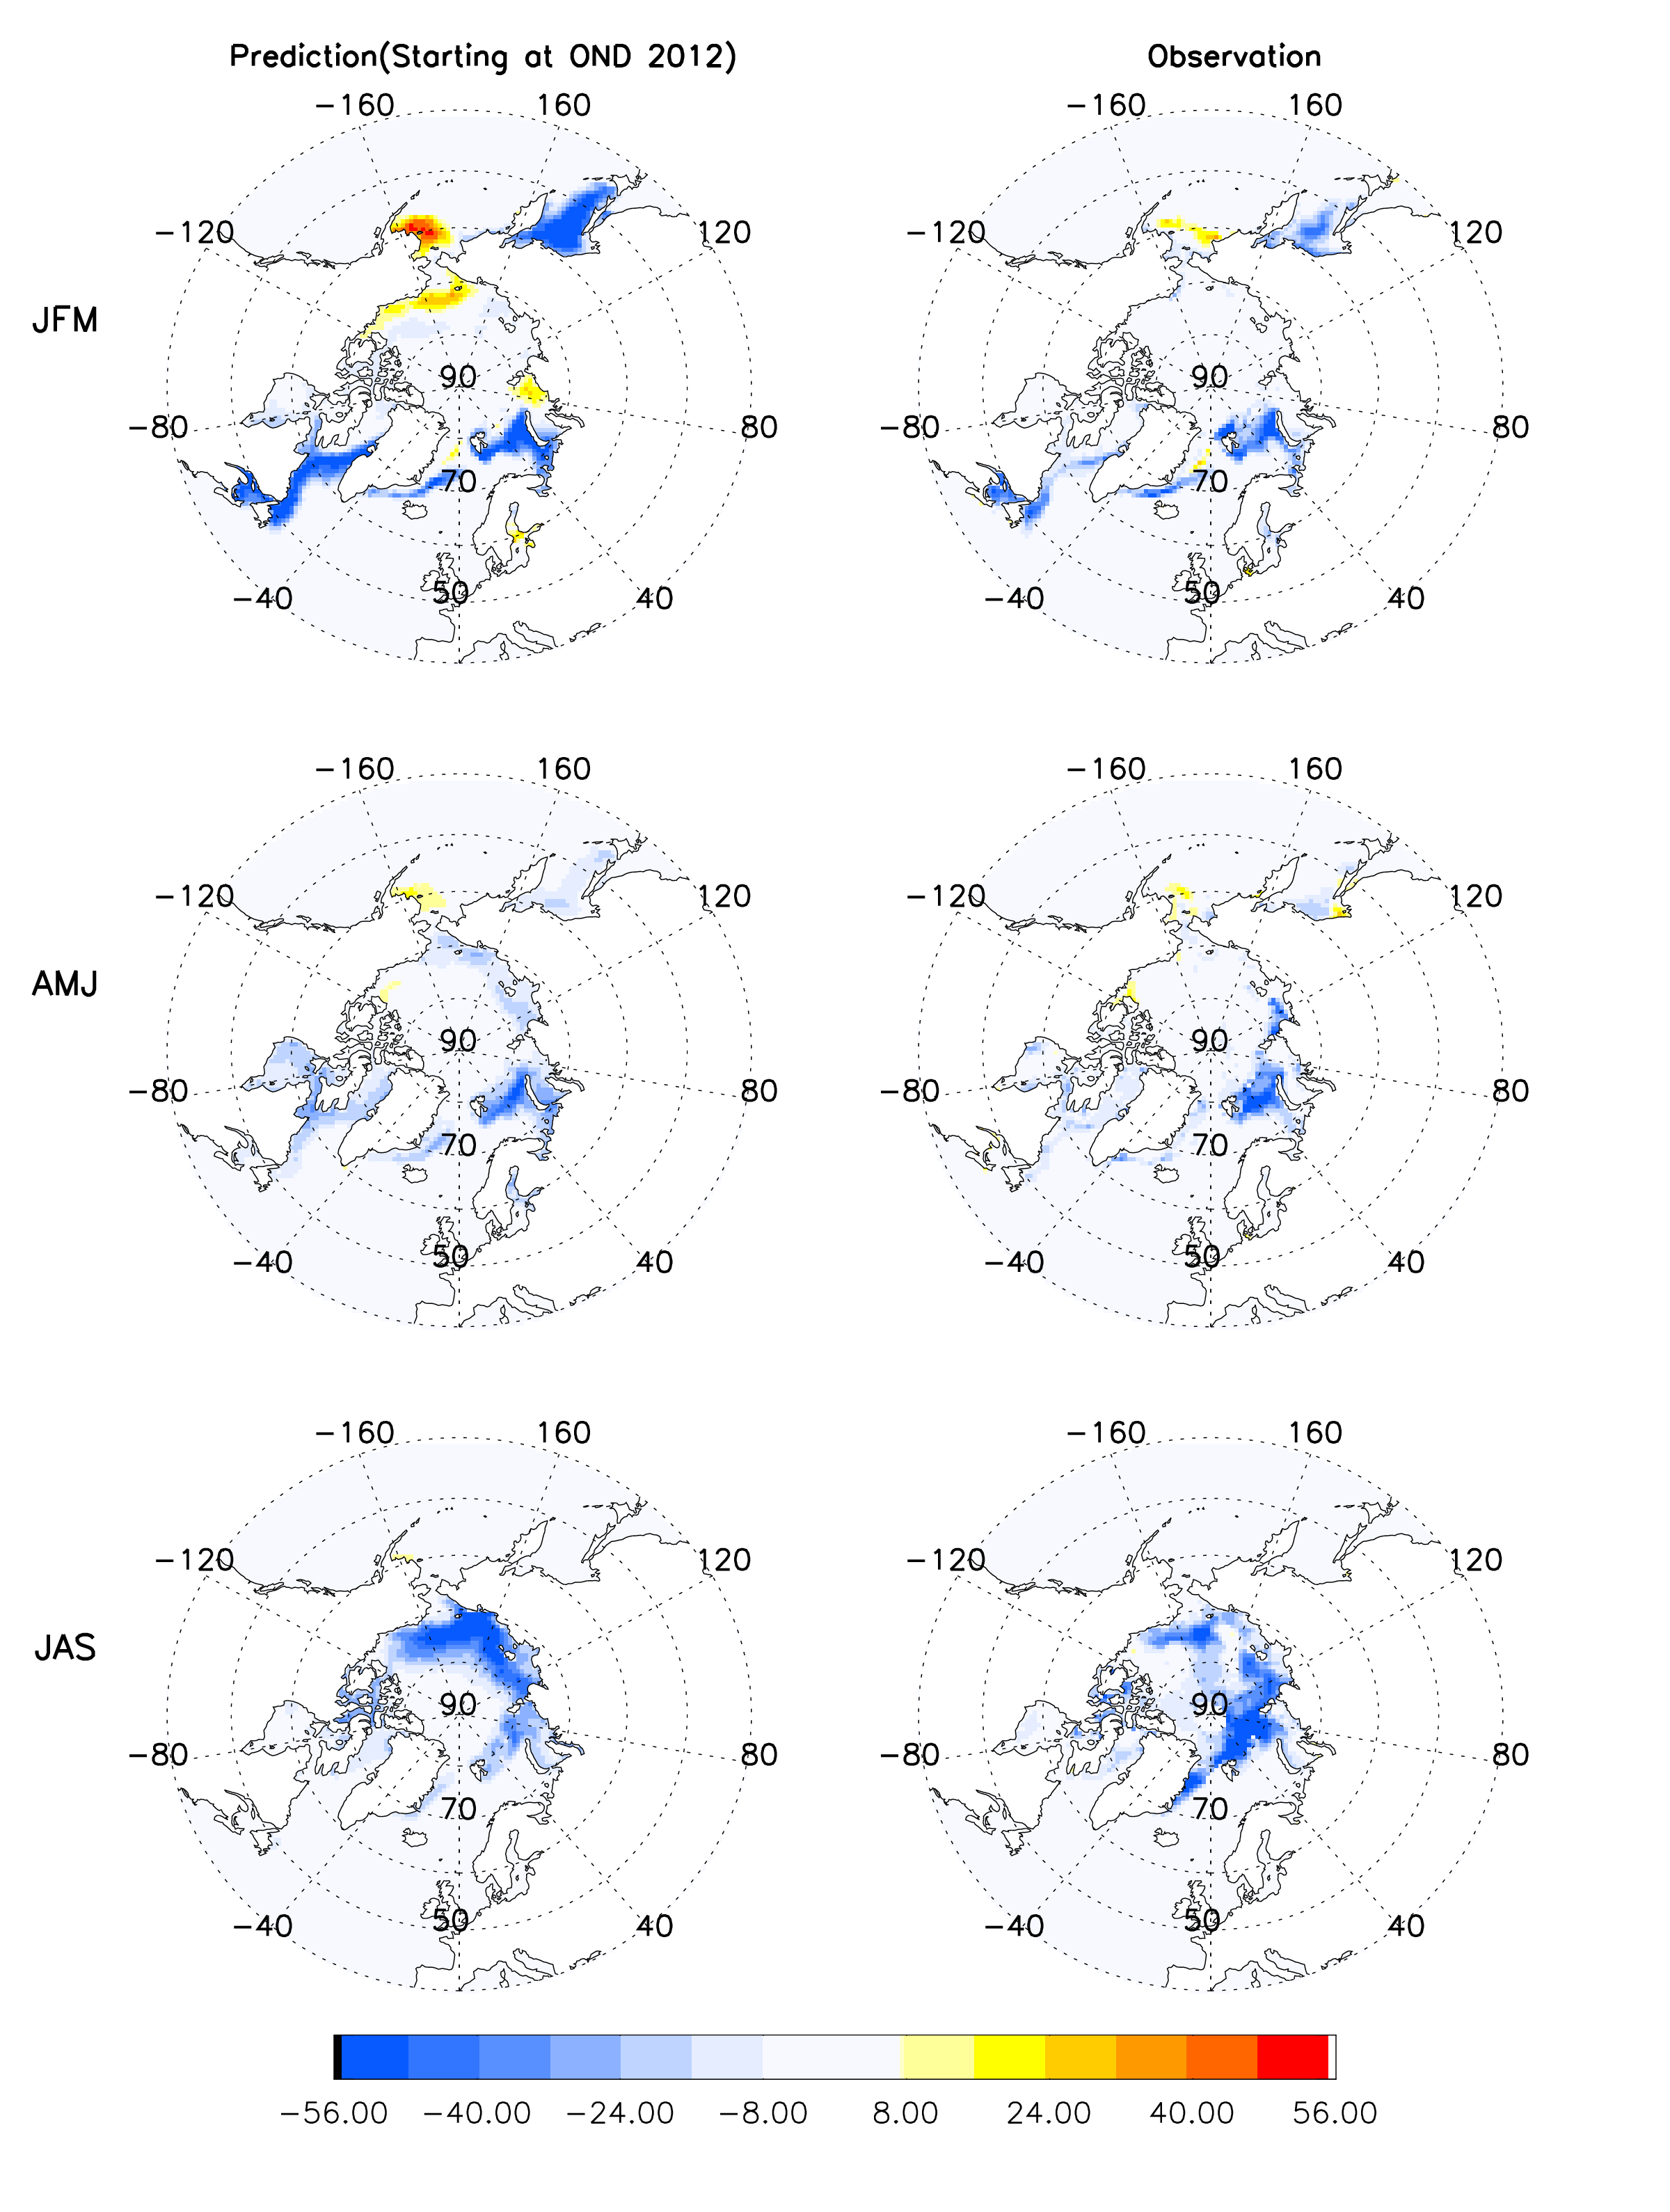
 Figure 4. Comparison of ice anomaly real-time model forecasts (left column) with observations (right column). The model was initialized using the observations in OND, 2012, and forecasts were made for JFM (3-month lead), AMJ (6-month lead) and JAS (9-month lead).