|
U.S./Chinese Collaborative Study: Investigation of Bottom Water Formation in Prydz Bay, Antarctica
The field program will be carried out on board of R/V Xuelong during her annual trip to service Chinese Antarctic Stations. Program DescriptionSupported by National Science Foundation of United States and Chinese Arctic and Antarctic Administration, scientists from Lamont-Doherty Earth Observatory of Columbia University (Lamont), First Institute of Oceanography (FIO) and Polar Research Institute of China (PRIC) will collaboratively conduct three seasons of physical oceanography surveys in Prydz Bay, Antarctica to investigate the bottom water formation processes. Sponsors
National Science Foundation Principal Investigators
Xiaojun Yuan Field Work
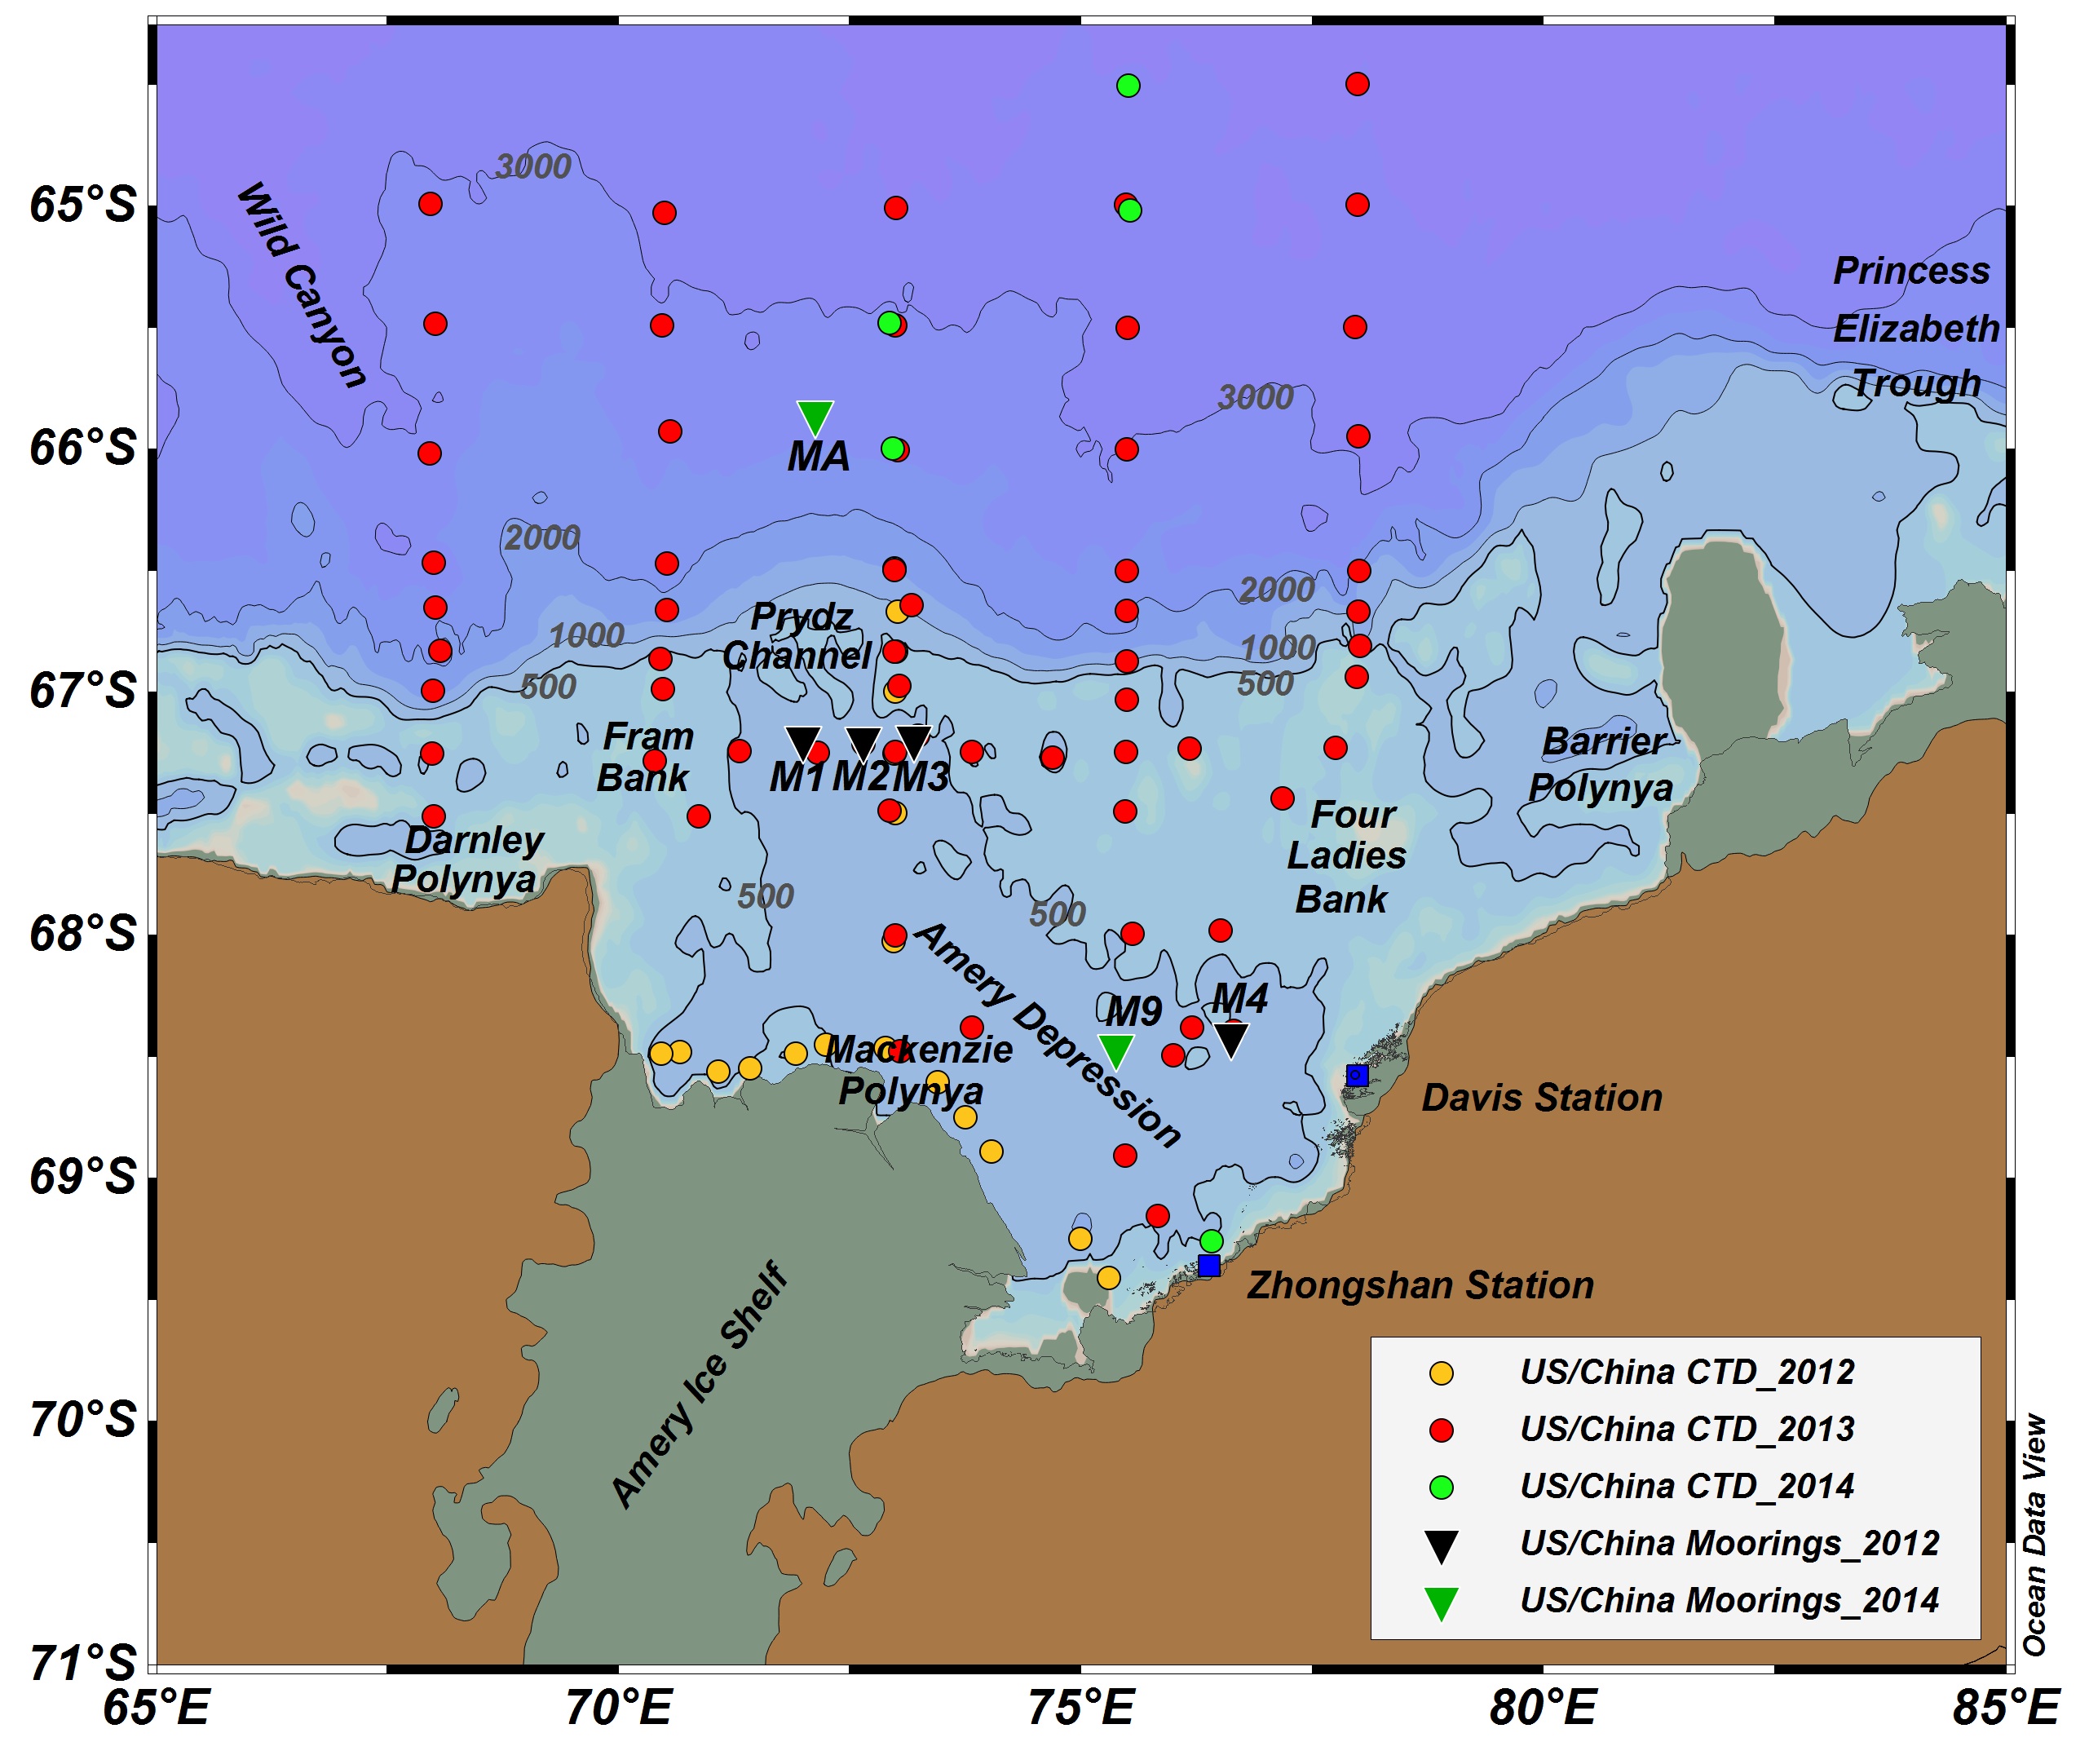
Preliminary ResultsTo investigate the AABW production in the Prydz Bay region, the program has conducted three seasons of fieldwork in 2012, 2013 and 2014 during XueLong's annual resupply trip (figure 1). Two CTD sections (yellow dots) were occupied and four moorings (M1, M2, M3, and M4) were deployed in 2012. In 2013, the team conducted 6 CTD sections (red dots) and redeployed M1 and M3. The fieldwork during February 2014 was only partially completed due to heavy sea ice, which prevented mooring recovery. XueLong managed to deploy two more moorings (M9 and MA) and conducted limited CTD (green dots). The data collected in 2012 and 2013 have been fully processed and preliminary results are presented here. The CTD section along 73°E was sampled in both 2012 and 2013, which captured mCDW entering the shelf region with similar behavior in both years. The mCDW with a temperature of -0.6°C and a salinity of 34.55 at the shelf break encounters the colder and fresher shelf upon its entering and flows upward on its southward intruding path, suggesting that it is less dense than the shelf water in summer. 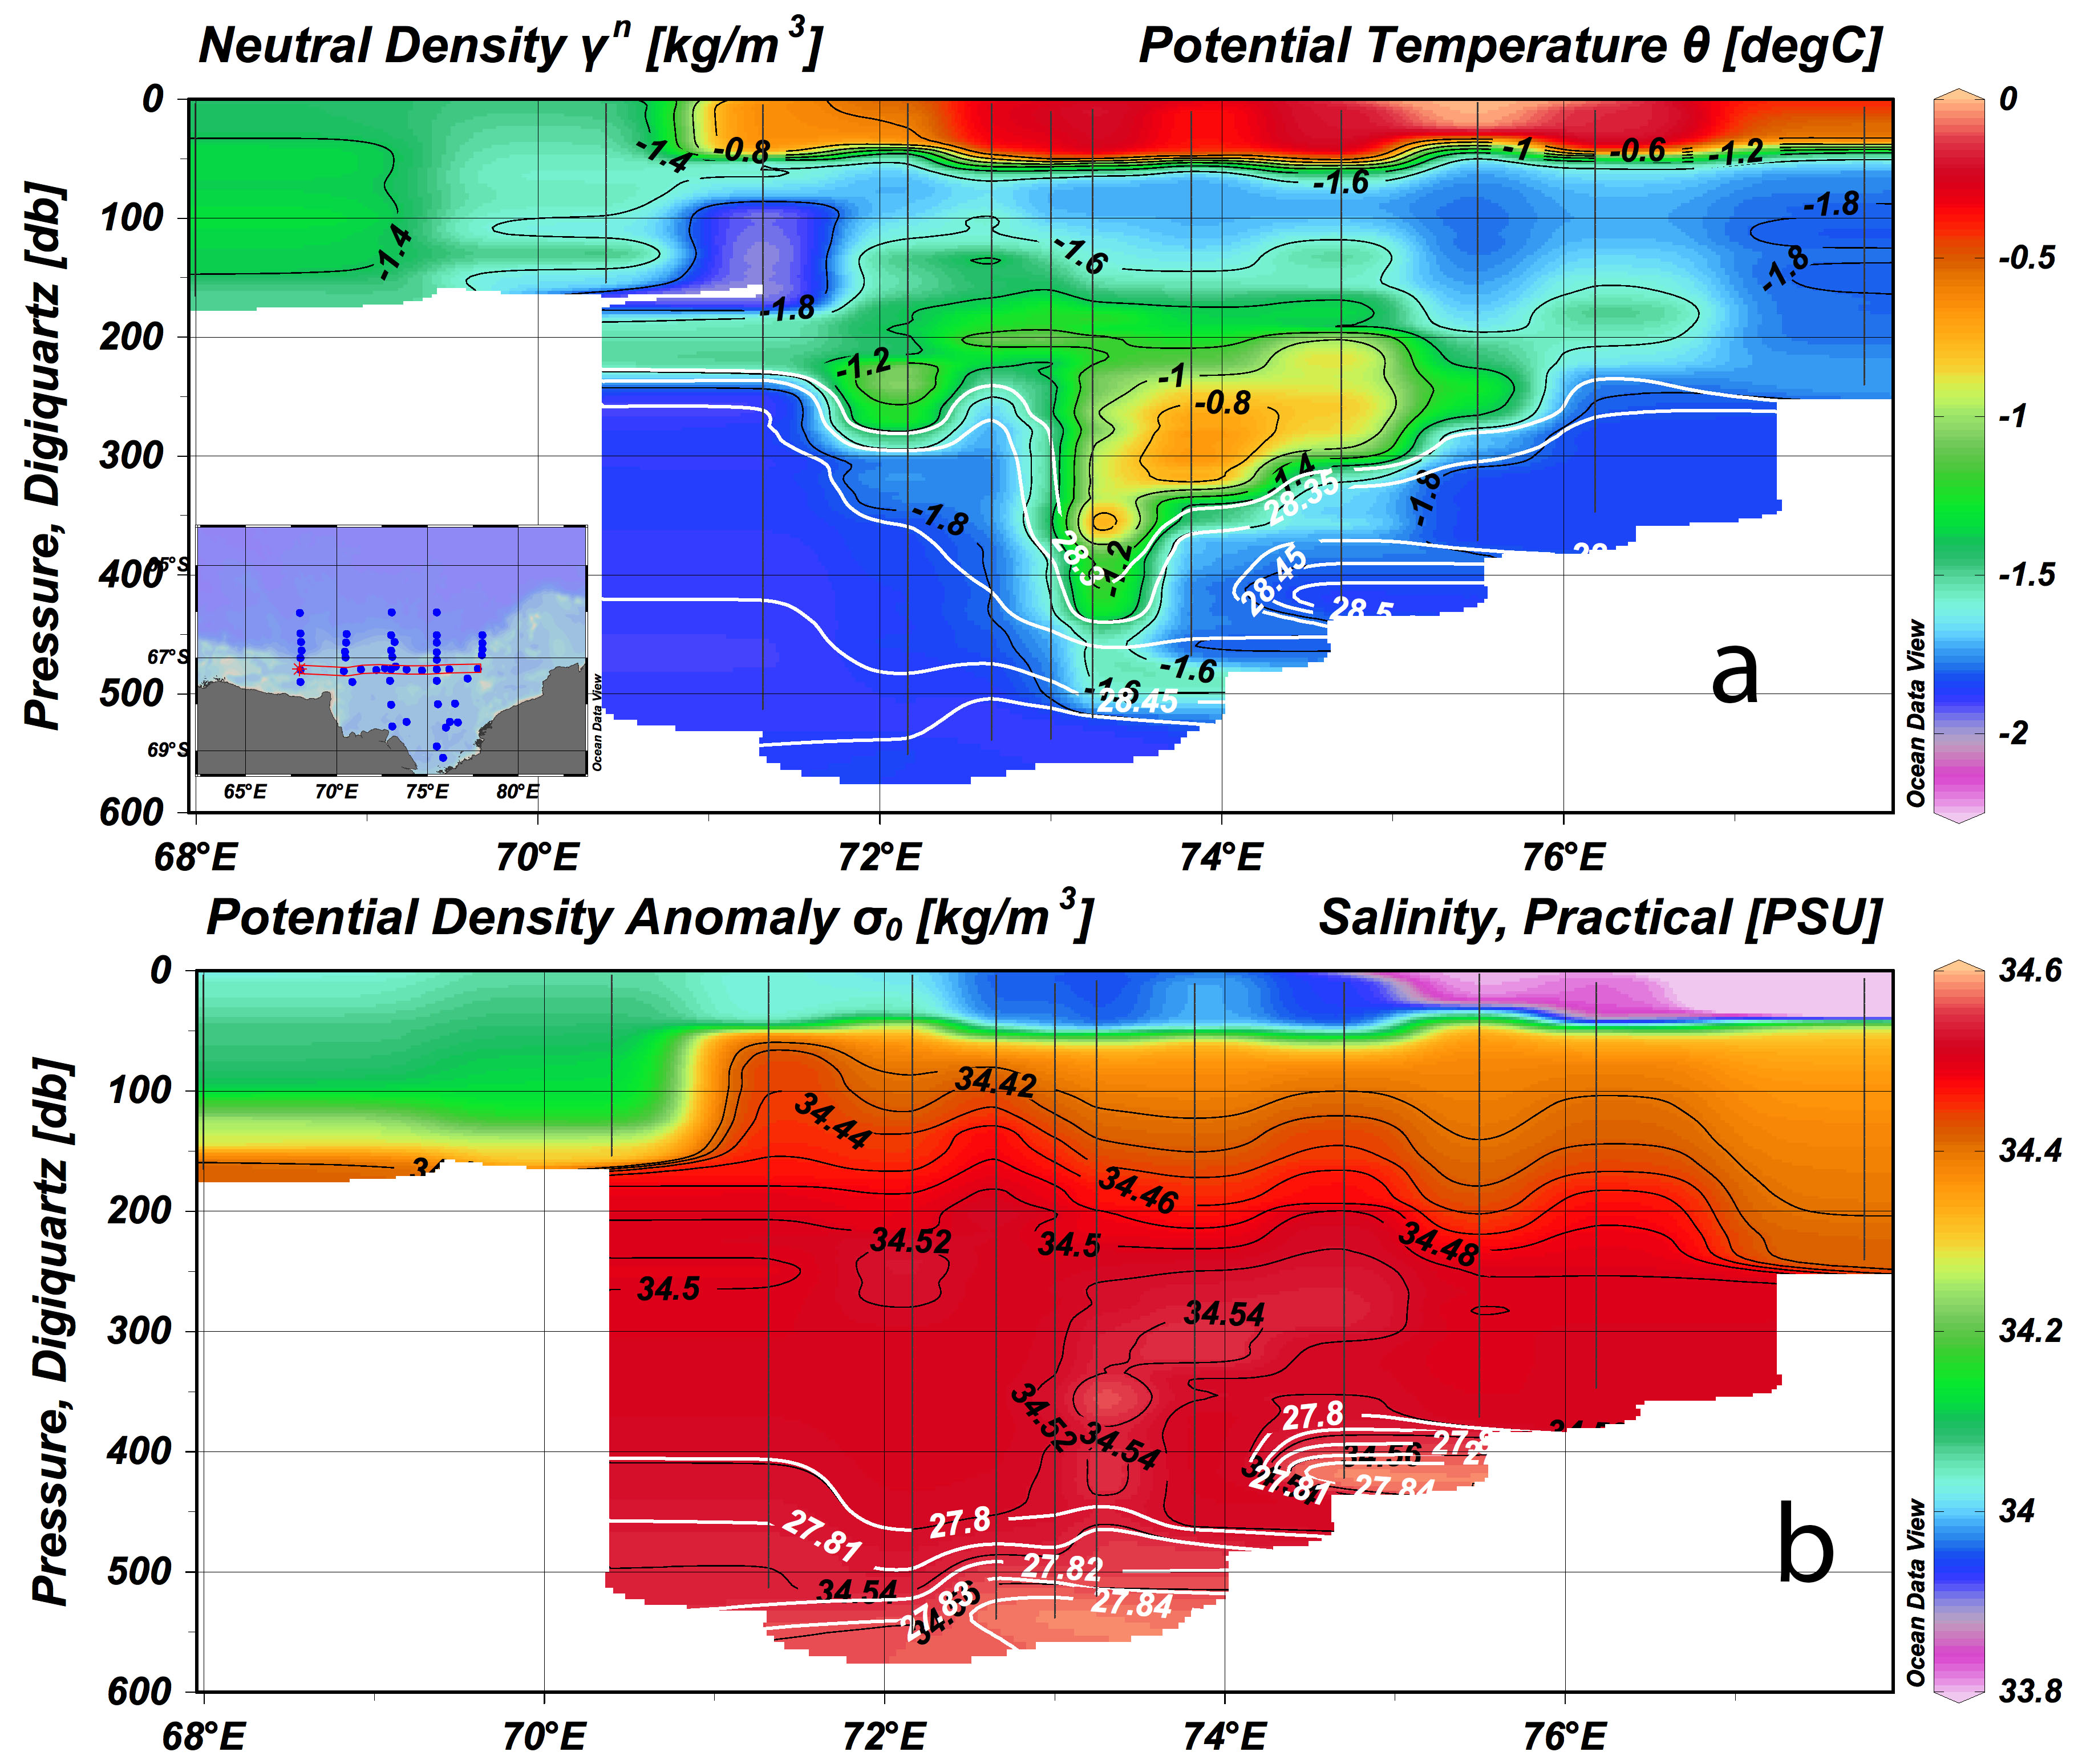 Figure 2 Potential temperature (a) and salinity (b) along shelf break occupied in 2/2013. Neutral density and potential density are superimposed in (a) and (b), respectively. The salinity jump is equivalent to 1.5m of sea ice formation, assuming that shelf water is mixed from top to bottom in August and the mean shelf water salinity is 34.50. This extreme ice formation event, together with moderate number of mCDW intrusion events and ice formation during August and September, elevate the mean salinity by 0.02 and the mean density by 0.015 kg/m Dense shelf water exists on the Prydz Bay shelf region even in austral summer. The lower water column (approximately 200m thick) has potential density higher than 27.80 kg/m 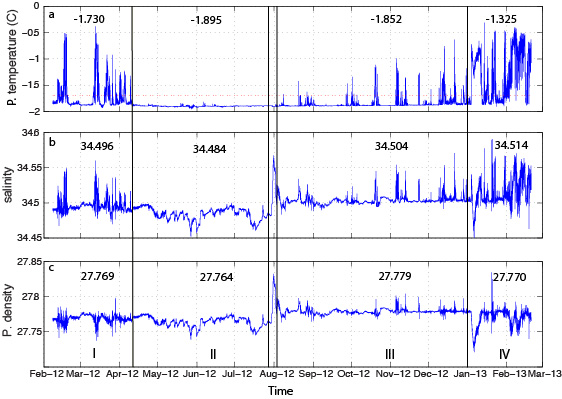 Figure 3. Potential temperature (a), salinity (b) and potential density (c) at 272m on M1 from 2/12/2012 to 2/12/2013 with a sampling rate of 15-minute. The vertical lines separate measurements into 4 periods according to their characteristics. The mean values of temperature, salinity and density in each period are marked in each panel. The circulation in the bay also favors export at Prydz Channel. M1 current meter at 347m (figure 1) recorded an annual mean speed of 7+/- 4 cm/s and mean direction of 10+/- 21 degree from north. The current does not have a clear seasonal cycle but the maximum speed can reach 31cm/s. The volume of dense shelf water is determined by amounts of mCDW intrusion and sea ice production. Estimates of salt injection from ice formation and salt fluxes delivered by mCDW are currently being constructed for the period of 2/2012 to 2/2013 using data from M1 and M3 moorings, surface winds from reanalysis and sea ice observations (Yuan et al., in preparation).
 Figure 4. Water properties and pressure near the bottom These property contrasts indicate that locally formed AABW (Cape Darnley bottom water) is guided by topography and flows northwest. East of the ridge, AABW was formed in remote source areas. Based on the historical LADCP data and bottom properties, we create a schematic flow pattern in the deep ocean basin (figure 5) to illustrate sources of AABW in the region: Weddell Sea AABW (blue arrows) is transported eastward in the northern part of the study area, while AABW formed in the Ross Sea and Adélie Land coast region (red arrows) is transported westward near the slope. AABWs from these two source regions are mixed in a cyclonic gyre circulation north of Prydz Bay. Locally formed Cape Darnley AABW (yellow arrows) flows all the way down to the deep basin beyond 3000m and turns westward (Sun et al. 2014). Our current results seem to suggest that any dense shelf water exported from Prydz Bay may not be dense enough to descent to the deep basin beyond 2000 m. Instead, it could flow westward on the slope to join the down slope flow west of Cape Darnley. The total AABW production rate in the region is yet to be quantified, particularly in the changing environment of freshening shelf water and warming deep water around Antarctica and in the Southern Ocean. 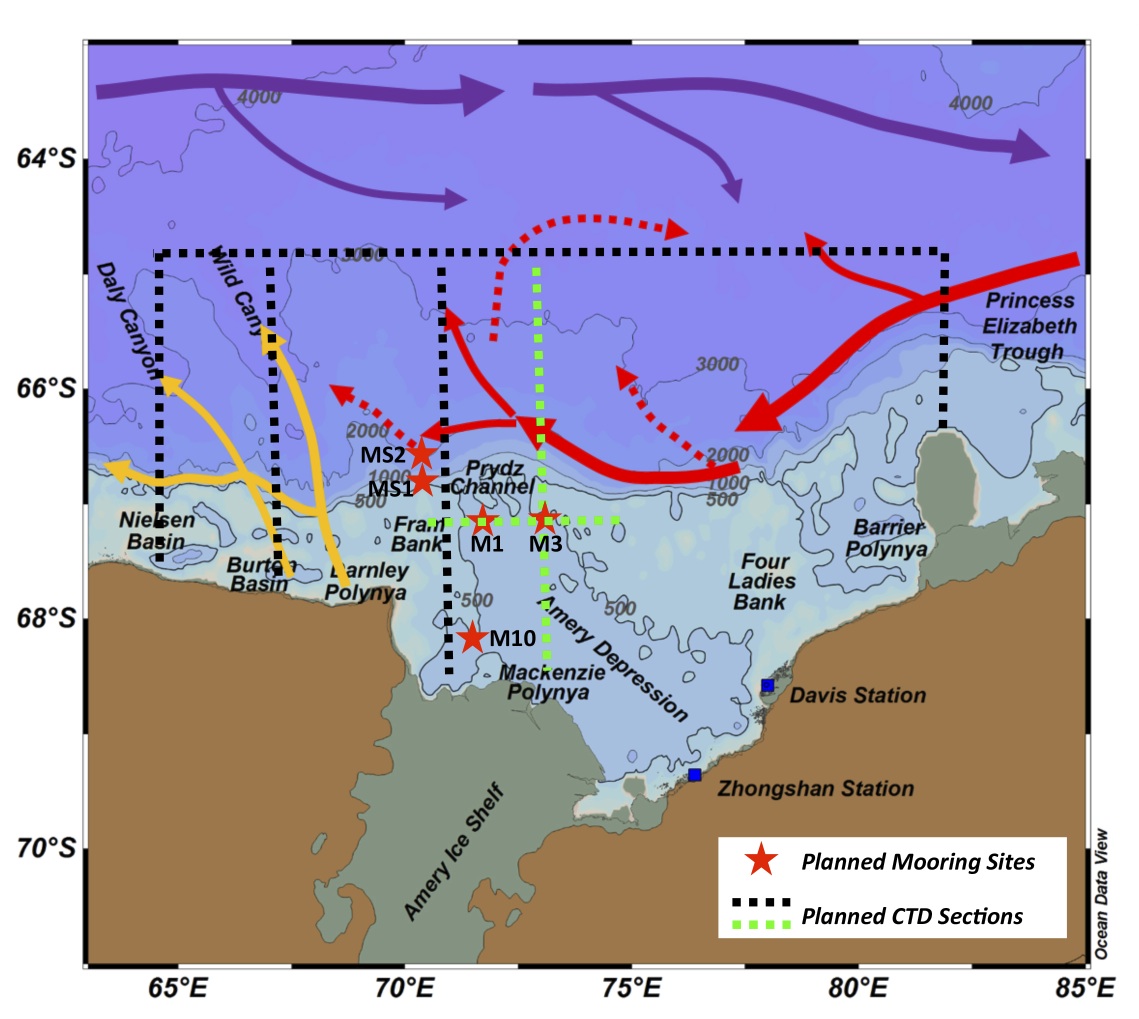 Figure 5 Schematic AABW flow pattern. AABW originated from the Weddell Sea (blue arrows), from Ross Sea/Aledie Land coastal region (red arrows) and from Cape Darnley (yellow arrows) are color-coded. Proposed subsurface moorings (MS1,MS2,M1,M3 and M10) are marked in red stars, while black and green dached lines indicate proposed CTD/LADCP sections. DataCTD Data 2012 Publications/PresentationsSun, Y., X. Yuan, J. Shi, L. Gao, Changes of Antarctic Bottom Water Properties in the Prydz Bay Region, Poster presentation, The Ocean Science Meeting, Honolulu, 2014. |

|

This page is maintained by Xiaojun Yuan (xyuan@ldeo.columbia.edu). The last update was on 5/18/2012