| Enterococci Main Page | Enterococci Presentation | 2006 Entero Event Results | 2007 Entero Event Results |
|---|
Study Plan
For 2007 we wanted to continue the study that Suzanne had started. Our study plan was to resample several sites along the Hudson River that had been sampled in 2006 (Fort Wadsworth, Habershaw Park, Steamboat, Longdock, Wayras Park and Ulster Landing*) for a comparison to prior year. We hoped for dry weather conditions so we could run a comparison between wet and dry weather results. If enterococcus (ENT) contributions were being elevated by weather related overflowing sewage, wet weather findings that were high should drop during dry weather sampling. If ENT contributions were coming from a steady ongoing source within the watershed then the readings would remain elevated in dry weather sampling. It turned out that the weather leading up to Snapshot Day was dry so we were able to run our study to look at dry versus wet weather impacts on ENT readings.
(*Due to a long dry spell prior to Snapshot Day, Ulster Landing, one of the creeks we sampled in 2006 which we hoped to resample in 2007 went dry and we could not get a sample.)
We added another variable to our study by including several sampling sites where there were tributaries entering the river. We hoped to see if tributaries were contributing to the ENT totals in the river.
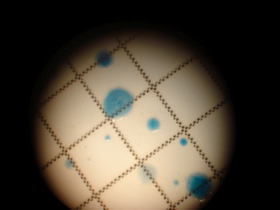
Samples were collected and labelled by our student groups and then put on ice or refrigerated to keep them cold. Samples were returned to Lamont-Doherty Earth Observatory where within 24 hours of collection where research scientist Dr. Greg O'Mullan filtered and plated each field sample, setting up three replicates of each sample - one plate using 10ml of sample and two plates using 20ml of sample. A blank sample was set up as a control. Samples were then incubated for 24 hours and the number of colonies formed counted. The counted colonies were then multiplied by the sample size to get to 100ml of sample. For example the 10ml plate results were multiplied by 10 since 10 ml is 1/10th of 100ml. What would you multiply the 20 ml sample by to get to the totals for 100ml? _________(your answer) The incubated blank (or control) showed no enterococcus. The results of the river water samples are listed below.
Summary of Findings
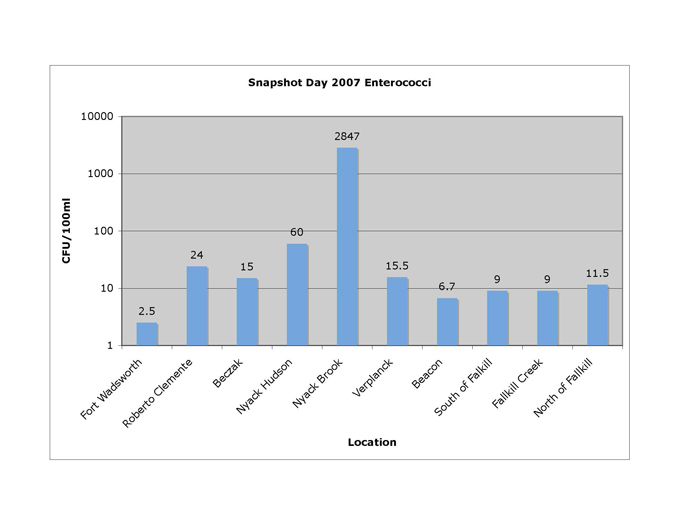
The EPA standard for a single sample maximum is 104 Colony Forming Units (CFU) per 100ml. The chart below contains the results of the samples gathered by the student groups on Snapshot Day 2007. Overall, the Entero counts are very low. There was a small signal in all of the samples. Now look at the sample collected at Nyack Brook (RM 28) where the Brook connects to the Hudson River, just beside the Nyack Hudson River sampling site. Do these numbers catch your eye? This is the only sample that exceeds the listed EPA standard for single sample CFU with it's reading. Nyack Brook seems to have a source of contamination. In order to learn more about this we would need to sample Nyack Brook on several dates and at several locations. Is Nyack Brook contributing ENT to the Hudson River? It is interesting to note that the next highest sample (60 CFUs/100ml) was from RM 28 in Nyack, where the brook enters the River. It does seem likely that Nyack Brook is adding ENT to the Hudson River.
| LOCATION | SAMPLING TIDE | RIVER MILE |
|---|---|---|
| Fort Wadsworth | Flood | Fort Wadsorth |
| Roberto Clemente | Flood | Harlem RM 12 |
| Habershaw Park | Flood | RM 18 |
| Nyack Brook | Flood | RM 28 |
| Nyack (Hudson) | Flood | RM 28 |
| Steamboat | Flood | RM 41 |
| Long Dock | Not Noted | RM 61E |
| Waryas Park (South of Fallkill) | Ebb | RM 76 |
| Fallkill Creek | Ebb | RM 76.1 |
| North of Fallkill | Ebb | RM 76.2 |
* Note - Samples were collected at most sites on a flood tide, however if you refer to the tides page for 2007 you can determine the actual tide at the time of sampling (refer to the chart below for RM).
Why do we care about the tides for this study? One piece of this study examined the possible contributions from tributaries to enterococci totals in the Hudson River. If sampling occurred on flood tide, when water from the Hudson is being pushed up into the tributaries, the samples collected from the tributaries would have Hudson River water mixed with the water coming into the Hudson from the triutaries themselves. These samples would not be as representative of the tributary contribution as sampling occurring on an ebb tide, when water is being pulled out of the estuary.
 |
|---|
Please note this is data for educational purposes and is not intended for use as scientific research data.