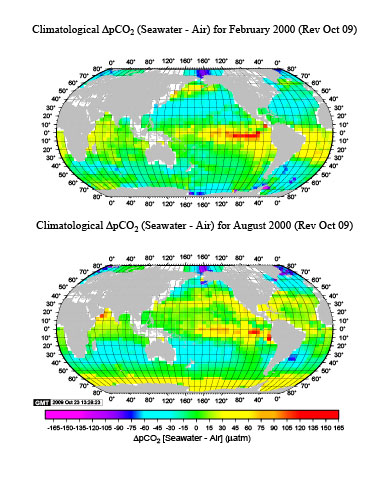

A climatological mean distribution for the surface water pCO2 over the global oceans in non-El Niño conditions are presented with spatial resolution of 4° (latitude) x 5° (longitude) for a reference year 2000 based upon about 3 million measurements of surface water pCO2 obtained from 1970 to 2007 (Takahashi et al., 2009). The database used for this study is archived at the Carbon Dioxide Information and Analysis Center (CDIAC), Oak Ridge, National Laboratory, (Version 1.0, Takahashi et al., 2008), and is about 3 times larger than the 0.94 million used for our earlier paper (Takahashi et al., 2002). A time-trend analysis using deseasonalized surface water pCO2 data in portions of the North Atlantic, North and South Pacific and Southern Oceans (which cover about 27% of the global ocean areas) indicates that the surface water pCO2 over these oceanic areas has increased on average at a mean rate of 1.5 uatm/yr with basin-specific rates varying between 1.2 ± 0.5 and 2.1 ± 0.4 uatm/yr. A global ocean database for a single reference year 2000 is assembled using this mean rate for correcting observations made in different years to the reference year. Although it cannot be thoroughly documented due to the limited extent of observations, seasonal changes in pCO2 in the Southern Ocean are approximated by using the data for under-ice waters during austral winter and those for the marginal ice and ice-free zones. The observations made during El Niño periods in the equatorial Pacific and those made in coastal zones are excluded from the database.
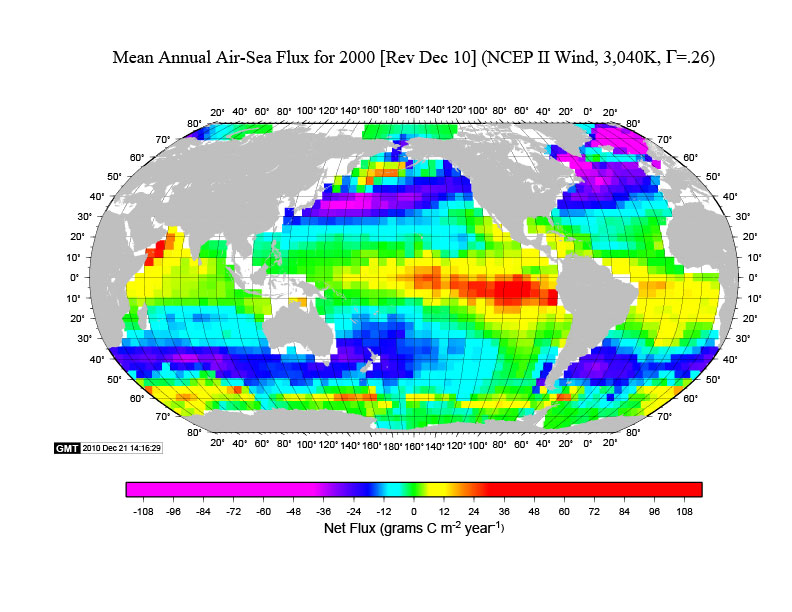
The net air-sea CO2 flux is estimated using the sea-air pCO2 difference and the air-sea gas transfer rate that is parameterized as a function of (wind speed)2 with a scaling factor of 0.26. This is estimated by inverting the bomb Carbon-14 data using Ocean General Circulation models and the 1979-2005 NCEP-DOE AMIP-II Reanalysis (R-2) wind speed data. The equatorial Pacific (14°N-14°S) is the major source for atmospheric CO2, emitting about +0.48 Pg-C / yr, and the temperate oceans between 14° and 50° in the both hemispheres are the major sink zones with an uptake flux of -0.70 Pg-C/yr for the northern and –1.05 Pg-C/yr for the southern zone. The high latitude North Atlantic, including the Nordic Seas and portion of the Arctic Sea, is the most intense CO2 sink area on the basis of per unit area, with a mean of –2.5 tons-C / month / km^2 (1 Ton = 10^6 grams). This is due to the combination of the low pCO2 in seawater and high gas exchange rates. In the ice-free zone of the Southern Ocean (50°S-62°S), the mean annual flux is small (-0.06 Pg-C/yr) because of a cancellation of the summer uptake CO2 flux with the winter release of CO2 caused by deepwater upwelling. The annual mean for the contemporary net CO2 uptake flux over the global oceans is estimated to be -1.4 ± 0.7 Pg-C/yr. Taking the pre-industrial steady state ocean source of 0.4 ± 0.2 Pg-C/yr into account, the total ocean uptake flux including the anthropogenic CO2 is estimated to be –2.0 ± 0.7 Pg-C/yr in 2000.
REFERENCES:
Takahashi, T., Sutherland, S. C., Sweeney, C., Poisson, A., Metzl, N., Tillbrook, B., Bates, N., Wanninkhof, R., Feely, R. A., Sabine, C., Olafsson, J. and Nojiri, Y. (2002). Global sea-air CO2 flux based on climatological surface ocean pCO2, and seasonal biological and temperature effects, Deep-Sea Res. II, 49, 1601-1622.
Takahashi, T., Sutherland, S. C. and Kozyr, A. (2008). Global Ocean Surface Water Partial Pressure of CO2 Database: Measurements Performed during 1968-2006 (Version 1.0). ORNL/CDIAC-152, NDP-088. Carbon Dioxide Information Analysis Center, Oak Ridge National Laboratory, U. S. Department of Energy, Oak Ridge, TN 37831, pp.20.
Takahashi, T., S. C. Sutherland, R. Wanninkhof, C. Sweeney, R. A. Feely, D. W. Chipman, B. Hales, G. Friederich, F. Chavez, A. Watson, D. C. E. Bakker, U. Schuster, N. Metzl, H. Yoshikawa-Inoue, M. Ishii, T. Midorikawa, Y. Nojiri, C. Sabine, J. Olafsson, Th. S. Arnarson, B. Tilbrook, T. Johannessen, A. Olsen, Richard Bellerby, A. Körtzinger, T. Steinhoff, M. Hoppema, H. J. W. de Baar, C. S. Wong, Bruno Delille and N. R. Bates (2009). Climatological mean and decadal changes in surface ocean pCO2, and net sea-air CO2 flux over the global oceans. Deep-Sea Res. II, 56, 554-577