At the 2002 SSA meeting, Dr. Peter Bormann encouraged me to make a set of
Figures that correctly display, side-by-side, the following three items: a
velocity profile; a set of correctly drawn rays; and the corresponding reduced
travel-time curve.
I completed them, one set for a velocity increase with depth; and a second
set for the same velocity increase, but with the addition of a deeper low
velocity zone.
Here they are.
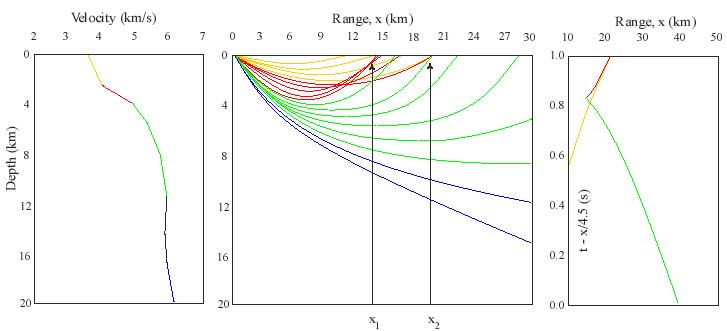
A velocity increase with depth, resulting in a triplication, shown with rays
and reduced travel-time curve. The colors of the rays indicate the depth range
within which the ray has a turning point (shown with the corresponding color on
the left).
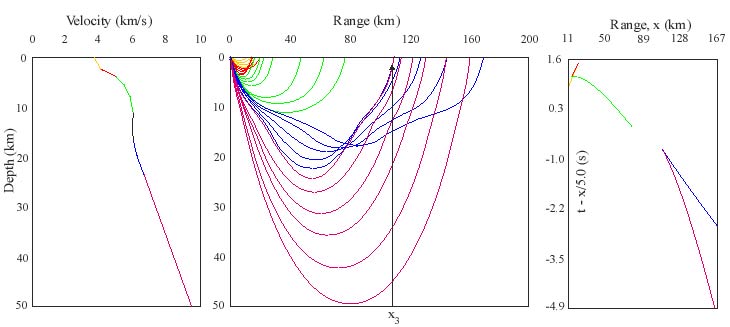
The effects of a deeper low velocity zone are added to the previous example.
As well as the triplication at shorter distances, there is now a shadow (a
range of depths, within which no rays arrive). The far end of the shadow is a
caustic, beyond which there are two arrivals (one a forward branch, for which
steeper rays go to greater distances; one a backward branch, for which steeper
rays go to nearer distances).
Dr. Bormann included these Figures along with explanatory text in the New
Manual of Seismological Observatory Practice. The NMSOP has been available, two
volumes with 1252 pages plus CD-ROM with the Manual pdf file and animations of
ray propagation and seismogram formation in the distance range 100 km up to 167
degrees. In the early 21st century it could be ordered from the
GeoForschungsZentrum (GFZ) library, c/o Mr. Roland Bertelmann, E-mail
rab@gfz-potsdam.de. Final price, shipment included, was about 60 EUR. But if this no longer works, I advise a
web search since NMSOP may be available in other ways…