| River Mile |
Location Name |
Percent Water Estimate |
Grain Size Estimate |
0 |
Gowanus Canal #1 |
High |
Medium Grain |
| |
Gowanus Canal #2 |
High |
Medium Grain |
| 13 |
Swinders Cove |
High |
Medium Grain |
| 18 |
Beczak |
High |
Fine/Medium Grain |
| 25 |
Piermont |
High |
Fine Grain |
| 32 |
Rockland Lake |
Low |
Fine Grain (Clay) |
| 41 |
Verplanck |
High |
Course/Sand |
| 87 |
Norrie Point |
Medium |
Highly Organic mixed with small amount of Fine Grain |
| 112.5 |
Dutchman's Landing |
Low |
Fine Grain (Clay) |
| 118 |
Cohotate |
Low |
Medium Grain |
| 124 |
Nutten Hook |
Low |
Highly Course/Sand |
| 151 |
Green Island |
Low |
Medium Grain |
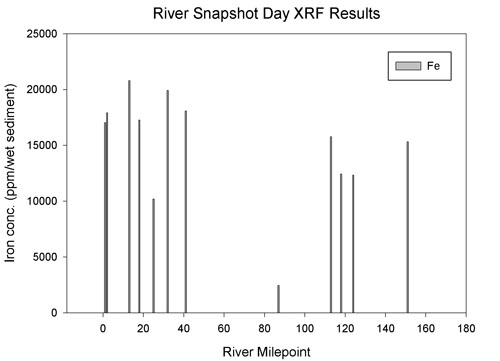
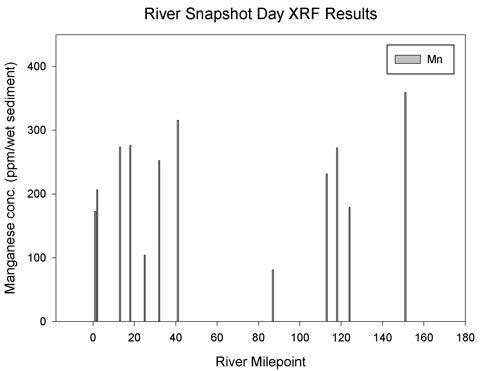
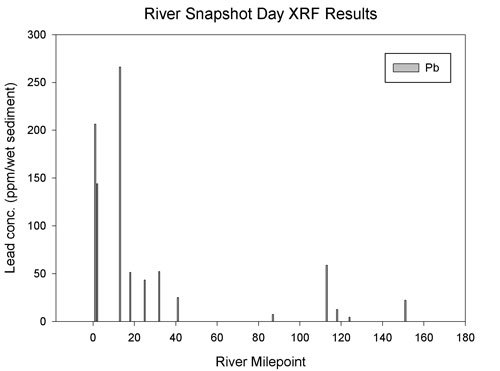
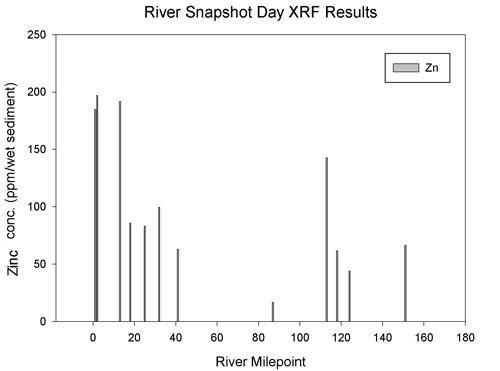
In the following graphic representations of the data collected for Snapshot Day lead and zinc concentrations are elevated at sites near the New York City, and less dramatically we see a small spike in the vicinity of Dutchman's Landing as well (at the confluence of the Catskill and the Hudson River). As noted above these are both metals with industrial applications and illustrate the influence of urban pollution. The lower two plots are of iron and manganese, which are naturally occurring metals. The concentrations for these metals do not exhibit the same trend as lead and zinc, showing a more even distribution throughout the river. Remember these numbers are based on wet samples. Actual values would INCREASE as the samples are dried which would amplify the results.
 |
 |
|
|
Below is the data that was collected and used to generate the graphs above. Each metal reading is in ppm and is followed by a margin or error (+/-) for the reading. To become more familiar with the data generate your own graph from this data using River Mile as the 'X' axis and the metals on the 'Y' axis. Use a different color for each metal as you graph it. Note that this is tricky due to the large Fe values compared to the other metals. (Suggest reducing these numbers by a factor of 100 before graphing since for this activity you are not concerned with overall values of these numbers just trends in the river). See if you can see the trends in the data.
