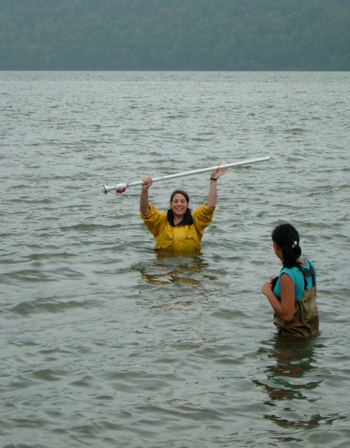
 The coring activity creates challenges and excitement!
| The coring activity creates challenges and excitement! |
|---|
| Sediment Sampling | 2005 Results | 2006 Results | 2007 Results |
|---|
Before reviewing this page please refer to the main Sediment's Page on this website for the necessary background information.
The chart below summarizes the core description information by River Mile/Location (with the tip of the Battery being designated as RM1) , an estimation of the amount of water in the sample, color description of the sample, estimated grain size and noted content of the sample. Why is this information useful? Refer back to the main Sediment page for a discussion on this topic.
River Mile |
Location Name |
% H2O |
Sed. Color |
Sed. Size |
Sed. Content |
-11 |
Breezy Pt. |
Medium |
light sandy tan |
Coarse Grain |
sand & shells |
-7 |
Ft. Wadsworth |
High |
sandy brown |
Coarse Grain |
sand & fines, small brick bits |
1 |
East River 1 |
Low |
Dark/chocolate brown |
Coarse Grain |
high sand, black flecks, small brick bits |
1 |
East River 2 |
Low |
Dark/chocolate brown |
Coarse Grain |
high sand, black flecks, small brick bits |
1 |
East River 3 |
Low |
Dark/chocolate brown |
Coarse Grain |
high sand, black flecks, small brick bits |
13 |
Swindler Cove |
Low |
Light brown |
Coarse Grain |
high sand, high rocks, large shell pieces |
14 |
Inwood |
Low |
Dark/Chocolate brown |
Fine- mud/silt |
roots, seed high organic/high mud |
25 |
Matheson Pk. |
High |
Brown/black mix |
Fine grain |
very fine sand |
28 |
Nyack |
High |
Dark brown |
Fine grain |
sand, shells, brick, detritus |
35 |
Croton |
Low |
Sandy tan |
Coarse Grain |
large sand grains, shells, rocks |
41 |
Verplank |
High |
Sandy brown |
Very coarse |
coarse sand, gravel & brick bits |
55 |
Little Stony Pt. |
Low |
Sandy brown |
Coarse Grain |
coarse sand & detritus |
58 |
Kowawese |
Low |
Dark brown |
Fine grain |
fine grain sand & large rock chunks |
76 |
Waryas Pk. |
Medium |
Dark brown |
Fine grain |
mud, sand, plants |
84.5 |
Norrie Pt. |
Medium |
Dark/chocolate brown |
Fine grain |
mud, plant material, gravel |
92 |
Kingston Pt. |
Low |
Reddish brown |
Very coarse |
coarse sand, gravel & brick bits |
96.5 |
Ulster Lnd. |
Low |
dark mud/clay |
Small sand grain |
high sand, some mud & brick |
102 |
Saugerties Lth. |
Low |
dark brown |
Sandy & clumpy |
mud and sand, plant threads |
115 |
Cohotate |
VERY High |
dark brown |
Fine grain |
find sand & plant detritus |
127 |
Stuyvesant Lnd. |
Medium |
dark mud/clay |
Sandy & mud |
high sand, some mud |
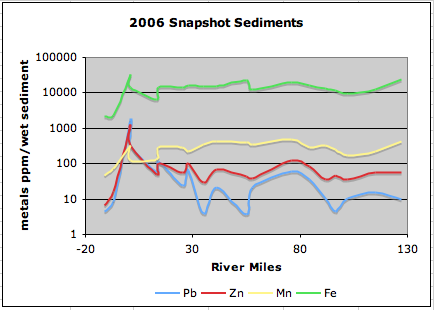
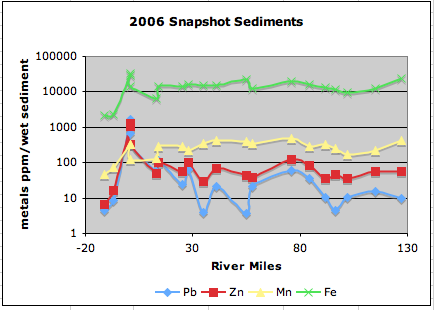
So what did our results look like in 2006? Examine the two graphs shown below. These graph represent the same information, just shown in different ways. Both graphs show the four main metals we have been focusing on for this sediment analysis. The first graph does not show the individual data points where samples were collected, while the second graph has a marker for each sample site. The spike that is represented in the lower end of the river is from samples taken in the East River ~RM1. Look at the 'lines' that indicate the readings for lead (Pb) and zinc (Zn) compared to the Maganese (Mg) and Iron (Fe). You will see there is much more variability in the ppm of Pb and Zn. The Mg and Fe amounts are a more consistent number throughout the sample area. After reviewing the information on our main Sediment page would the results shown below be consistent with what you would expect to find for these four metals in the Hudson River? The East River is well known for its industrial and commercial history. How does this piece of the river's past surface in the XRF results?
 |
 |
|---|
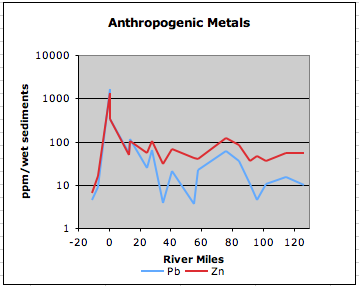
The chart below shows just the Pb and Zn amounts from the samples. Looking at these two metals together you can see there is a very consistent relationship between the readings. The spikes and valleys on the graph seem to echo each other. Since these are both metals tied to industrialization does it make sense that their numbers would show a positive relationship?
Below is the data that was collected and used to generate the graphs above. Each metal reading is in ppm. Remember these results are based on a wet analysis. A dry analysis would elevate these numbers. You can use the numeric data below for further study.
| Location | RM | Pb | Zn | Mn | Fe |
| Breezy Pt. | -11 | 4.44 | 6.44 | 47.89 | 2163.88 |
| Ft. Wadsworth | -7 | 8.67 | 16.32 | 73.52 | 2297.03 |
| East River 1 | 1 | 1671.4 | 1293.57 | 336.34 | 34176.79 |
| East River 2 | 1 | 679.19 | 1078.65 | 336.87 | 28175.2 |
| East River 3 | 1 | 328.43 | 326.75 | 122.41 | 14181.52 |
| Swindler Cove | 13 | 55.05 | 49.72 | 131.42 | 6675.1 |
| Inwood | 14 | 116.77 | 102.72 | 282.6 | 13851.38 |
| Matheson Pk. | 25 | 24.71 | 55.57 | 294.66 | 14343.95 |
| Nyack | 28 | 62.47 | 104.48 | 219.4 | 16003.21 |
| Croton | 35 | 3.81 | 29.82 | 358.73 | 15539.74 |
| Verplank | 41 | 20.79 | 67.67 | 419.21 | 15502.62 |
| Little Stony Pt. | 55 | 3.57 | 42.31 | 404.27 | 22529.64 |
| Kowawese | 58 | 21.41 | 38.8 | 342.4 | 12694.89 |
| Waryas Pk. | 76 | 61.16 | 122.07 | 484.25 | 19445.74 |
| Norrie Pt. | 84.5 | 34.94 | 85.01 | 289.39 | 15686.3 |
| Kingston Pt. | 92 | 10.6 | 36.2 | 326.34 | 12954.97 |
| Ulster Lnd. | 96.5 | 4.4 | 45.57 | 246.3 | 11921.7 |
| Saugerties Lth. | 102 | 10.32 | 35.92 | 167.94 | 9482.92 |
| Cohotate | 115 | 15.09 | 55.22 | 218.8 | 12855.27 |
| Stuyvesant Lnd. | 127 | 9.95 | 54.81 | 430.62 | 23561.98 |