

 |
 |
 |
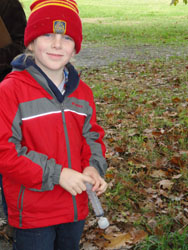
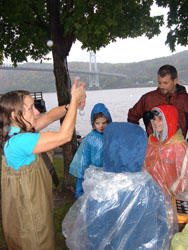
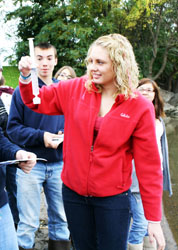
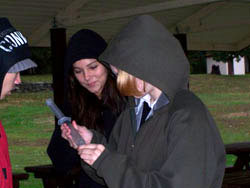
Beginning in Day in the Life 2005 each student sampling group used a syringe and filter set up to screen water samples in the field to collect suspended solids. The filters were immediately placed on ice away from the sun and then sent back to Lamont-Doherty Earth Observatory for laboratory analysis of chlorophyll a levels (protocol below) by Dr. Ajit Subramaniam. More recent samples have been run at Norrie Point by the Hudson River National Estuarine Research Reserve team following the same field collection protocols. A revies of Chlorophyll a and why we sample it during this event is covered below. For results on our sampling click on the years listed below for write up and data.
Chlorophyll a is the green pigment found in all photosynthetic organisms that allows plants (including algae - phytoplankton) to conduct photosynthesis. Remember photosynthesis is the process by which plants create sugar (food) and oxygen using light (from the sun), water, and carbon dioxide. Phytoplankton are primary producers - the base of the aquatic food chain - and thus are important to sustain life in the river. However, too much phytoplankton could cause degradation in water quality and so quantifying phytoplankton biomass is important. Scientists have found that there is a strong correlation between phytoplankton biomass and chlorophyll a concentration in the water. Therefore we are measuring chlorophyll a as a proxy for how much phytoplankton there is in the Hudson River.
Water samples were collected at each site. 120cc of river water was forced through a glass fiber filter. This method screens and collects the phytoplankton in the water (as well as other small particles) on the filter. The filters were placed in vials and frozen at the collection sites and returned to Lamont-Doherty Earth Observatory for analysis. Lamont scientists measured the samples by extracting the sample in acetone and then using a spectrophotometer. The spectrophotometer calculates the amount of light absorbed at specific wavelengths of the extract and that is used to calculate the chlorophyll a concentration.

Note that this data was collected as part of an educational activity and provides some interesting items for discussion and further analysis. As part of a first time collection process there are refinements that would be suggested and incorporated into future collection and analysis, which we hope to continue next year. Several of the samples did not completely extract and thus were not included in the data analysis. Data collected this first year is an excellent opportunity for study refinement, and for establishing some baseline numbers.
The results of the analysis are listed here and graphed below. A more representative sampling of chlorophyll levels would be collected in the main channel of the river where there is more complete mixing of the water column. Our sampling groups are located along the sides of the river thus the sampling might represent small micro systems in the river ( i.e. more representative of the specific areas where the water is collected).