
|
USArray Gallery
|

Here follow a list of figures with relevance to the idea of
a dense network of permanent stations in the USA. The figures
have been prepared by Bob Woodward and Harold Bolton of the USGS.
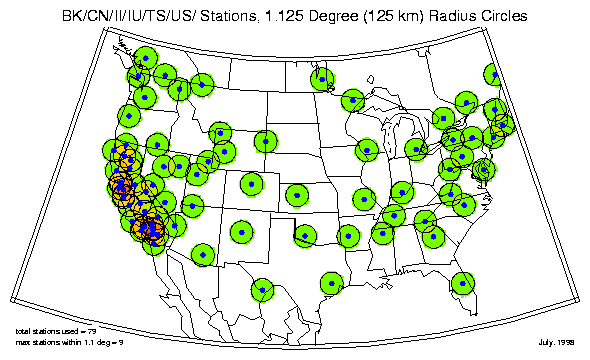
Station map 1
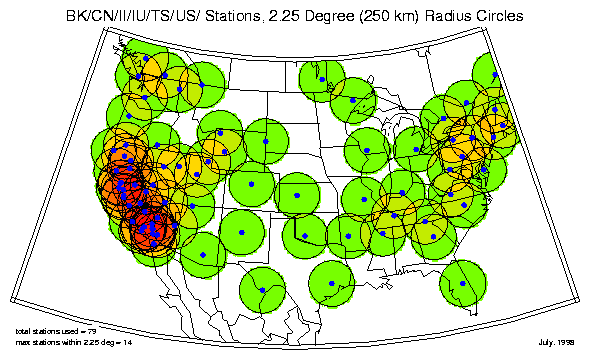
Station map 2
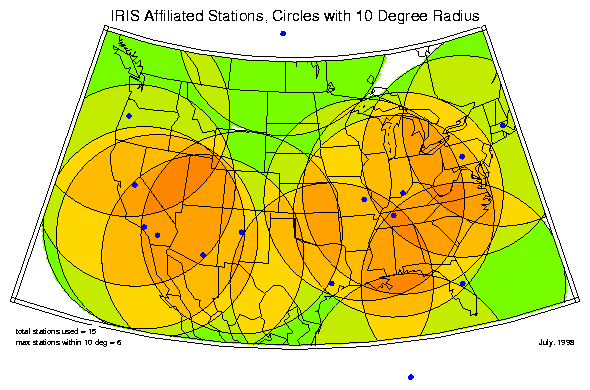
Station map 3
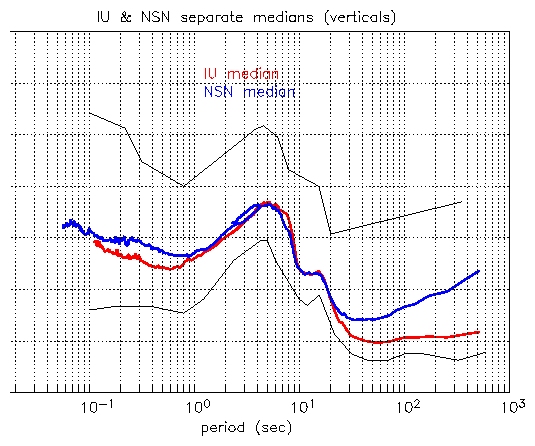
Median noise levels, NSN versus GSN/IU (Z)
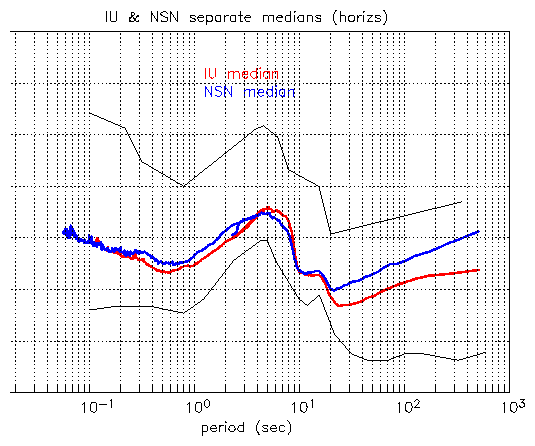
Median noise levels, NSN versus GSN/IU (NS,EW)
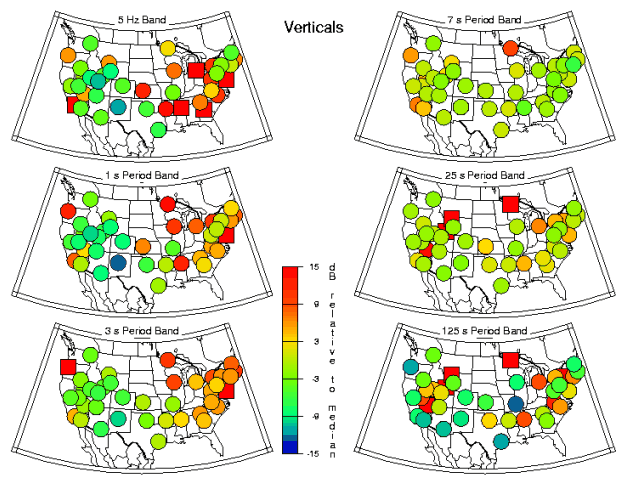
Relative Noise Levels (Z)
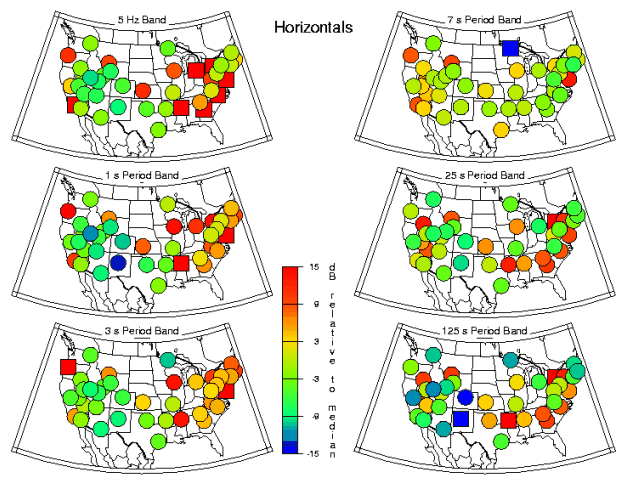
Relative Noise Levels (NS, EW)
Göran Ekström,
Department of Earth and Planetary Sciences, Harvard University,
copyright ©1998, all rights reserved